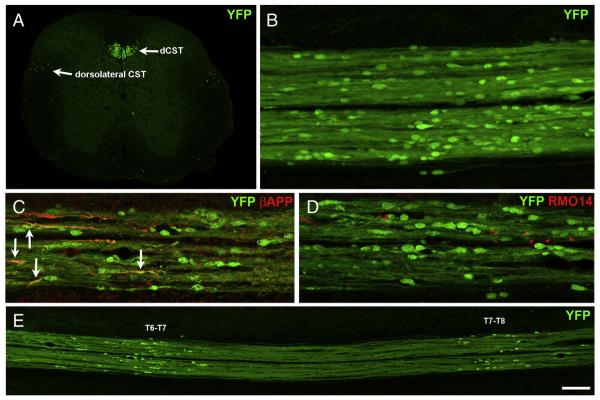
Fig. 4.
Axonal injury in the CST at 2 days after blast. A) Transverse section from a normal CST-YFP mouse at ~T11 showing YFP+ axons in the main dorsal component of the CST (dSCT), the minor dorsolateral component of the CST and scattered ventrally. The intensity level of the background has been increased so that the gray matter and the section boundaries are visible. B–E) Horizontal sections of the dCST at 2 days after blast. For all, rostral is toward the left. The bulbous YFP+ axonal profiles in the dCST are indicative of microtubule breakage. Note that the YFP+ bulbs vary in shape and size. The narrower labeled profiles may indicate breakage of only some of the microtubules in those axons and/or recent breakage. C shows immunolabeling for βAPP. Several YFP+/βAPP+ axonal profiles are marked by arrows. D shows immunolabeling using the RMO14 antibody to visualize neurofilament compaction. No YFP+ bulbs are also labeled with the RMO14 antibody. E is a low magnification view of an adjacent section from the same mouse in C and D, showing that the YFP+ bulbs are clustered in two regions. C is from the T6–T7 cluster; D is from the T7–T8 cluster. Scale bar in F = 200 μm for A and E; 67 μm for B–D.

