Fig. 7.
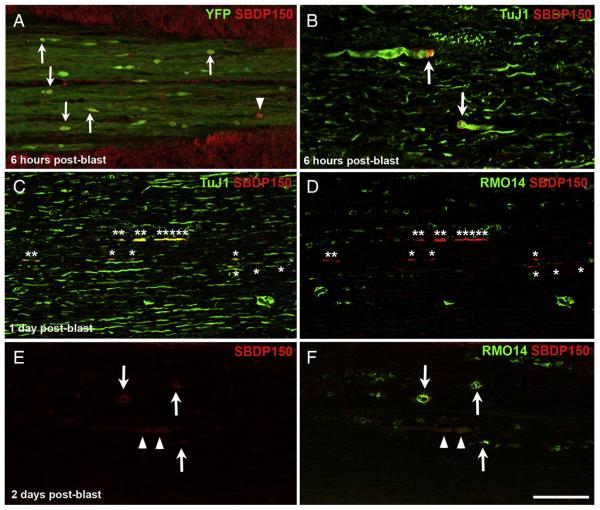
Spectrin proteolysis by calpain, visualized by SBDP150 immunolabeling. A) At 6 h after blast, several YFP+ bulbs in the dCST are labeled for SBDP150 (arrows). Arrowhead marks a SBDP150+ bulb that does not show obvious accumulation of YFP. B) Swollen TuJ1+ axonal profiles in the lateral white matter show intense SBDP150 immunolabeling along their margins at 6 h post-blast (arrows). Note that the images in panels A and B are shown at higher magnifications than those in panels C–F; accordingly, the swollen axonal profiles indicated by arrows in panel B are similar in size to those marked by arrowheads in panels E–F. C, D) At 1 day after blast, several axonal profiles label very intensely for SBDP150 but appear otherwise normal (asterisks). TuJ1 immunolabeling in C confirms that they indeed correspond to axons. In D, RMO14 immunolabeling of the same field of view shows that the SBDP150+ axonal profiles are a separate population from those labeled with RMO14. A few very large and numerous smaller RMO14+ axonal profiles can also be seen. E, F) At 2 days after blast, some SBDP150+ axonal profiles appear swollen (arrowheads) whereas others appear vacuolated and also label with RMO14 (arrows). E shows single labeling because the thin rim of SBDP150 underlying the axolemma is largely obscured by the RMO14 immunolabeling in F. Also note for panels D and F that RMO14+ axonal profiles are more abundant than SBDP150+ axonal profiles. Scale bar in F = 67 μm for A and B, 100 μm for C–F.

