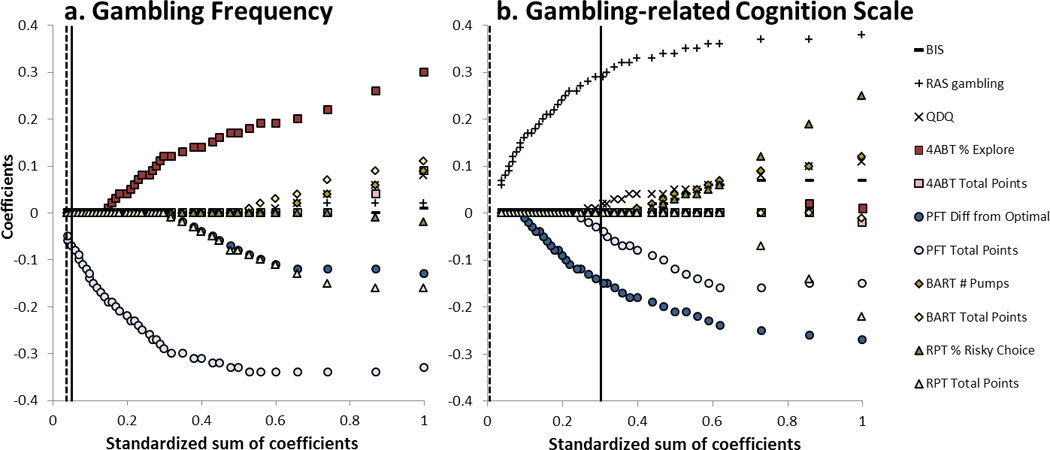
Figure 4.

Results of the elastic net model for a) gambling frequency, and b) gambling-related cognition scale scores. Values indicate the strength of regression effects (y-axis) for each variable as a function of model parsimony (x-axis). As values increase along the x-axis, the model becomes less parsimonious and additional variables enter the model (lines diverging from 0 along the y-axis). At a given parsimony (x-axis position), the y-axis value of the variable lines indicates the strength of that regression coefficient in the model. The solid vertical line indicates the optimal model, and the dashed vertical line indicates the most parsimonious model within one standard error. Only coefficients with nonzero values between these vertical lines should be considered to have relevance for predictive performance in the model.
