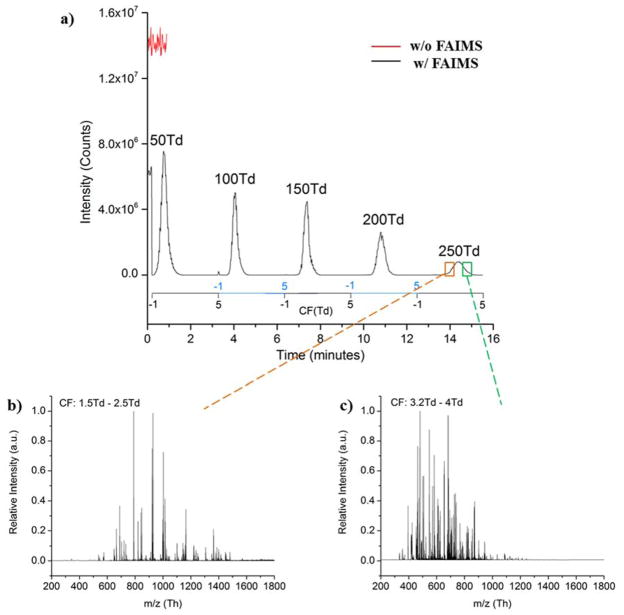
Figure 2.
a) Mass spectra signal for a 0.1 μg/μl solution of BSA in μFAIMS/IMS-MS analysis with (black) and without (red) the μFAIMS attached to the IMS-MS platform. The black trace represents the BSA signal with the μFAIMS coupled and activated at DF from 50 Td to 250 Td. The MS spectra extracted for 250 Td DF with b) 1.5 Td – 2.5 Td CF range, and c) 3.2 Td – 4 Td CF range.

