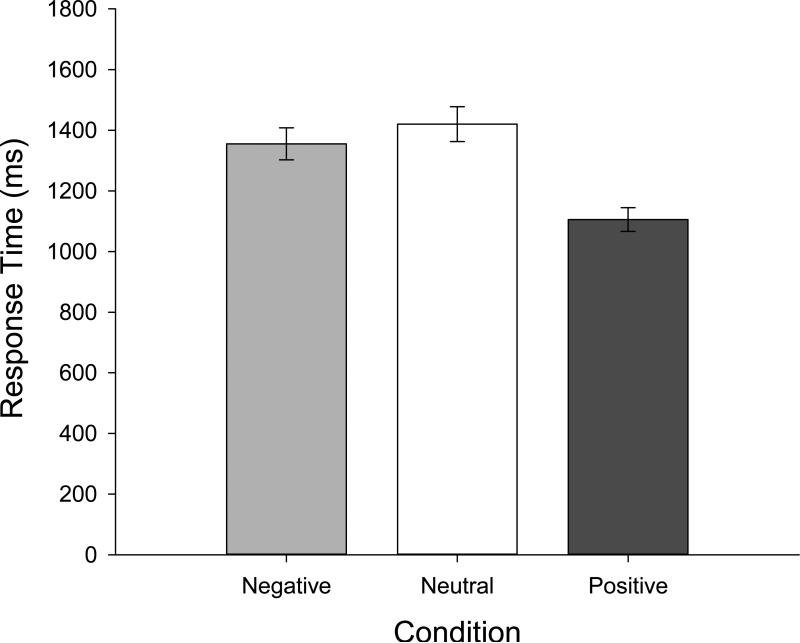
Figure 2.
Manual response time results from Experiment 1 plotted as a function of cue condition (negative, neutral, or positive). Mean correct RT was faster in the positive-cue condition (M=1105.69) than in the neutral-cue condition (M=1420.01), but there was no RT advantage for the negative-cue condition (M=1355.05) compared with the neutral-cue condition. Error bars represent within-subject 95% confidence intervals (Morey, 2008).

