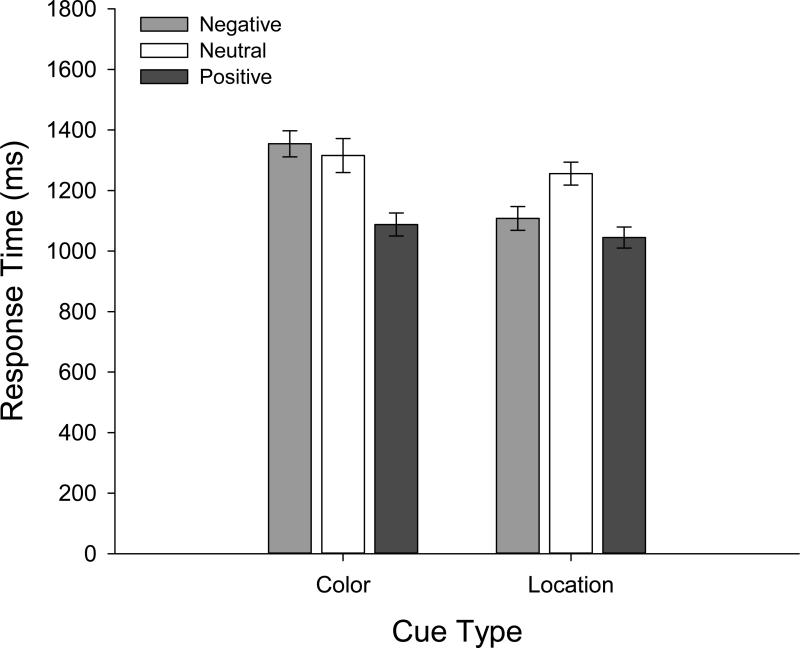
Figure 6.
Manual response time results from Experiment 2 plotted as a function of cue type (color, location) and collapsed across array type (segregated, mixed) since this did not result in any significant effects. When given a location cue, participants were faster to respond to the target item in both the negative-cue (M=1107.97) and positive-cue (M=1044.60) conditions compared with neutral (M=1255.94). When given a color cue (as in Experiment 1), participants demonstrated a positive-cue benefit (M=1087.84) compared with the neutral-cue condition (M=1315.81), but not a negative-cue benefit (M=1354.44). Error bars represent within-subject 95% confidence intervals (Morey, 2008).

