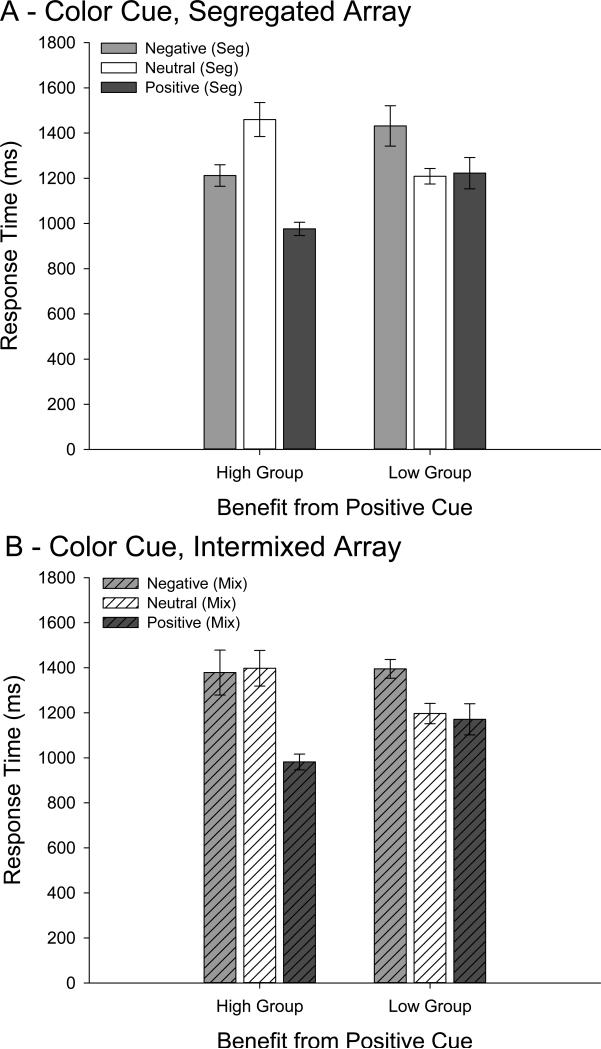
Figure 8.
As in Experiment 1, participants were split into two groups based on magnitude of positive cue benefit: high group (greatest positive cue benefit, N=9), low group (least positive cue benefit, N=9). Participants in the high group demonstrated a reliable negative cue benefit (M=1212.32), relative to the neutral condition (M=1459.93), but only when the different colored items were segregated by hemifield (panel A). When the different colored items were mixed within each hemifield (panel B), participants in the high group no longer demonstrated a benefit from the negative cue (M=1378.57), relative to the neutral condition (M=1397.77). Participants in the low group did not demonstrate a negative cue benefit for either array type. Error bars represent within-subject 95% confidence intervals (Morey, 2008).

