
Figure 4. Locomotor Activity.
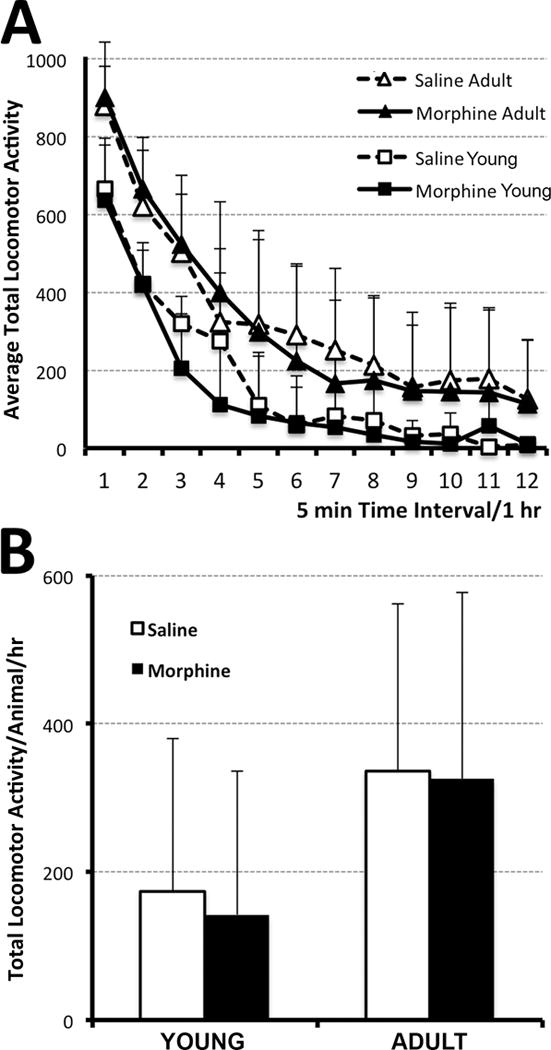
Graphs illustrate average total locomotor activity (which include ambulatory, fine, and rearing movements) ± SD at two different ages: either at young age (one-week after the pharmacological treatment; PD27) or in adulthood (8 weeks after treatment; PD55-56). Morphine sulfate (10mg/kg sc twice-daily) or equivalent volume of saline was injected for 14 days starting on PD1. (A) Average Total Locomotor Activity over a period of 1 hr (twelve 5 min intervals). Although the mean values for locomotor activity are slightly lower for younger animals (N=10 for saline group; N=7 for morphine group) in comparison to adult (N=17 for saline group; N=21 for morphine group), there were no significant differences at any of the time points. Panel B summarized total average locomotor activity/animal/hr. It did not differ with either pharmacological treatment or age. One-way ANOVA with Tukey HSD test.