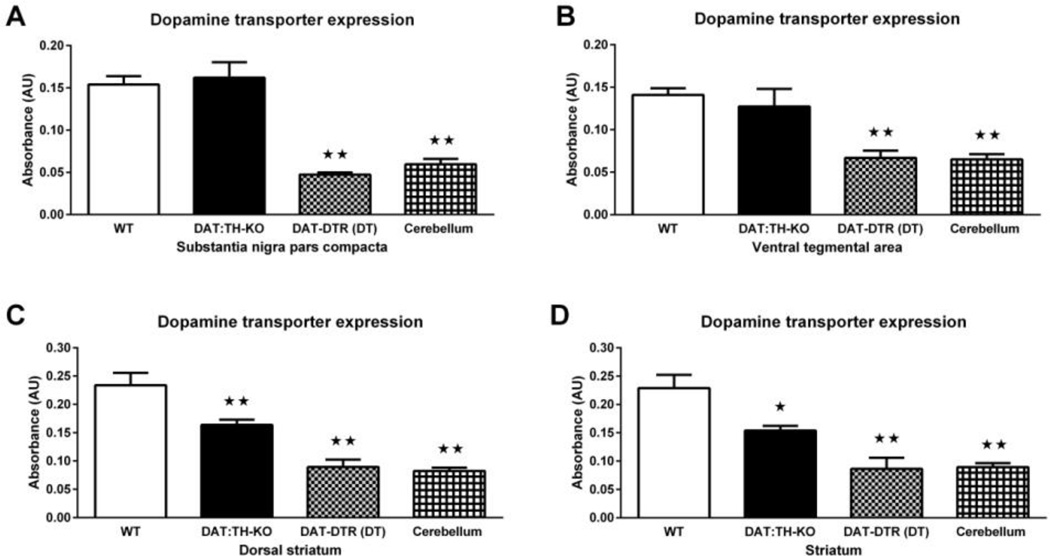
Fig. 1.
DAT expression in midbrain and striatum measured by ELISA. (A) DAT expression in SNpc dissections from WT (N = 11), DAT:TH-KO (N = 4) and DAT-DTR (DT) (N = 6) mice. (B) DAT expression in VTA dissections from WT (N = 11, DAT:TH-KO (N = 4) and DAT-DTR (DT) (N = 4) mice. (C) DAT expression in tissue punches containing dorsal striatum from WT (N = 6), DAT:TH-KO (N = 6) and DAT-DTR (DT) (N = 6) mice. (C) DAT expression in tissue punches containing ventral striatum from WT (N = 6), DAT:TH-KO (N = 6) and DAT-DTR (DT) (N = 6) mice. As a negative control, DAT-expression in WT cerebellum is also shown. Midbrain samples were analyzed together with one set of cerebellar WT samples (n = 6), and striatal samples were analyzed together with an additional set of cerebellar WT samples (n = 6). Significant differences from control groups are marked with stars (★★ p < 0.01). All data are shown as means ± SEM.

