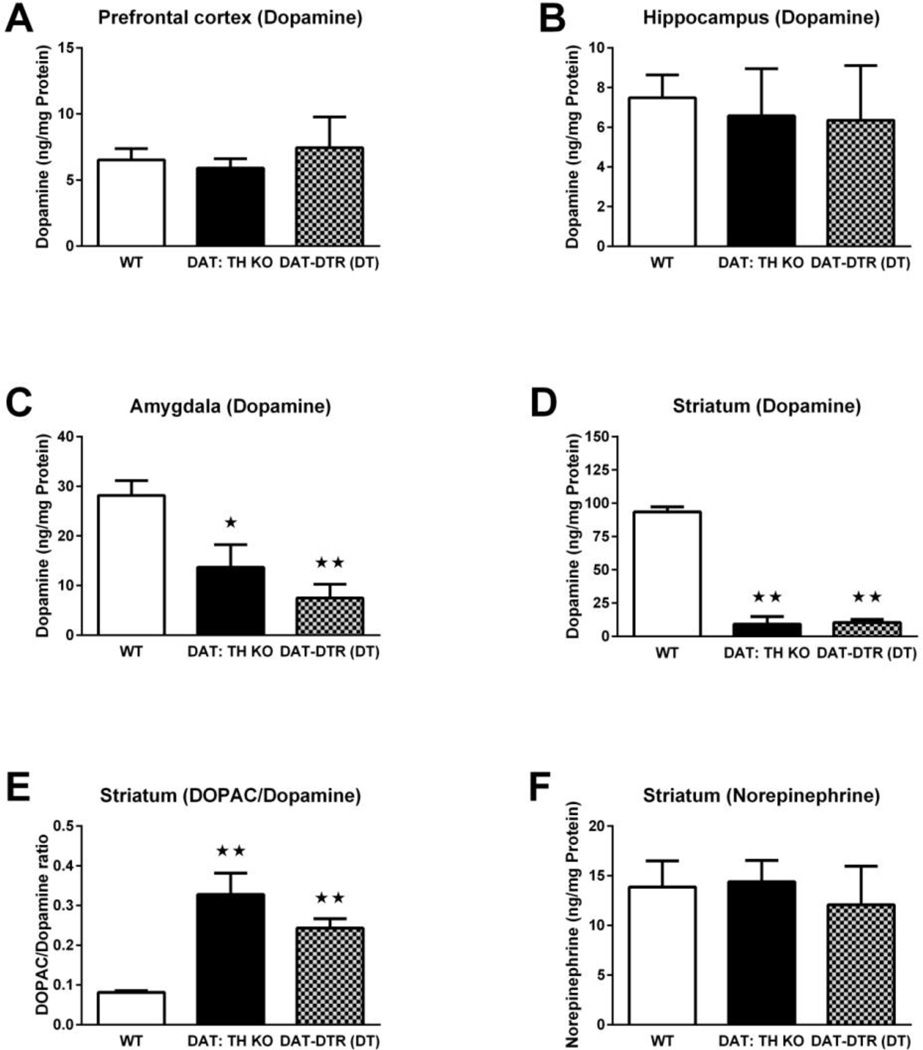
Fig. 2.
Tissue content of DA, the DOPAC/DA ratio and tissue content of norepinephrine in DA projection fields. (A) DA content in the prefrontal cortex of WT (N = 24), DAT:TH-KO (N = 4) and DAT-DTR (DT) (N = 8) mice. (B) DA content in the hippocampus of WT (N = 10), DAT:TH-KO (N = 4) and DAT-DTR (DT) (N = 2) mice. (C) DA content in the amygdala of WT (N = 21), DAT:TH-KO (N = 14) and DAT-DTR (DT) (N = 7) mice. (D) DA content in the striatum of WT (N = 22), DAT:TH-KO (N = 10) and DAT-DTR (DT) (N = 17) mice. (E) DOPAC/DA ratio in the striatum of WT (N = 21), DAT:TH-KO (N = 10) and DAT-DTR (DT) (N = 12) mice. (F) Norepinephrine levels in the striatum of WT (N = 20), DAT:TH-KO (N = 13) and DAT-DTR (DT) (N = 5) mice. Significant differences from control groups are marked with stars (★★ p < 0.01, ★ p < 0.05). All data are shown as means ± SEM.

