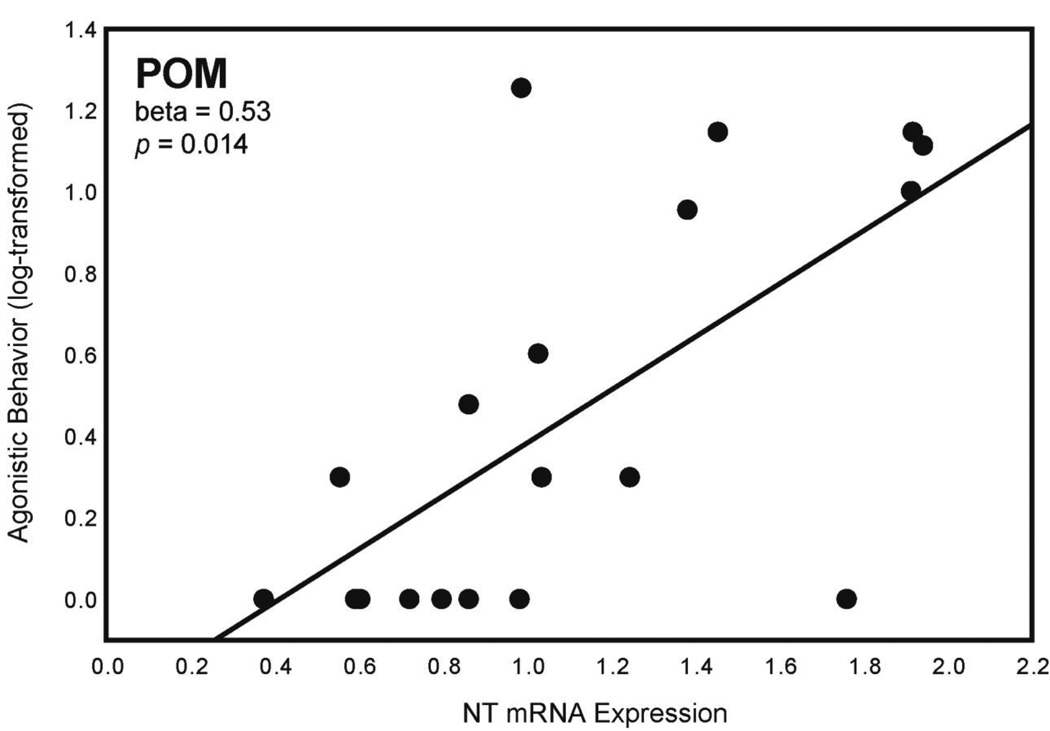
Figure 3. NT expression in POM and agonistic behavior.
Two-dimensional visualization of a multiple regression model with 1 significant variable showing the relationship between NT mRNA expression in POM (X-axis; presented as a ratio as described in Section 2.5) and agonistic behavior (log-transformed; Y-axis). n = 20.

