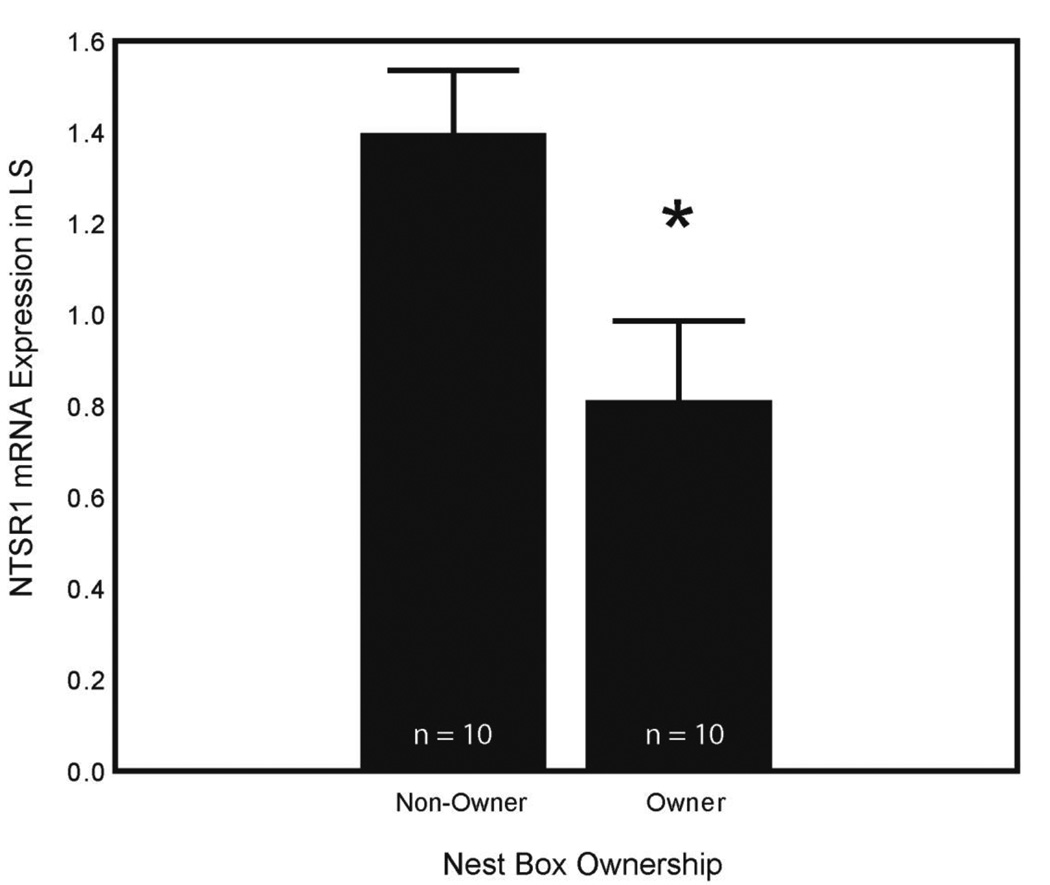
Figure 5. NTSR1 expression in LS and nest box ownership.
Mean plot (+SEM) showing NTSR1 mRNA expression (presented as a ratio as described in Section 2.5) in LS in next box owners (n = 10) and non-owners (n = 10). Asterisk indicates a significant difference between nest box owners and non-owners (p = 0.020).

