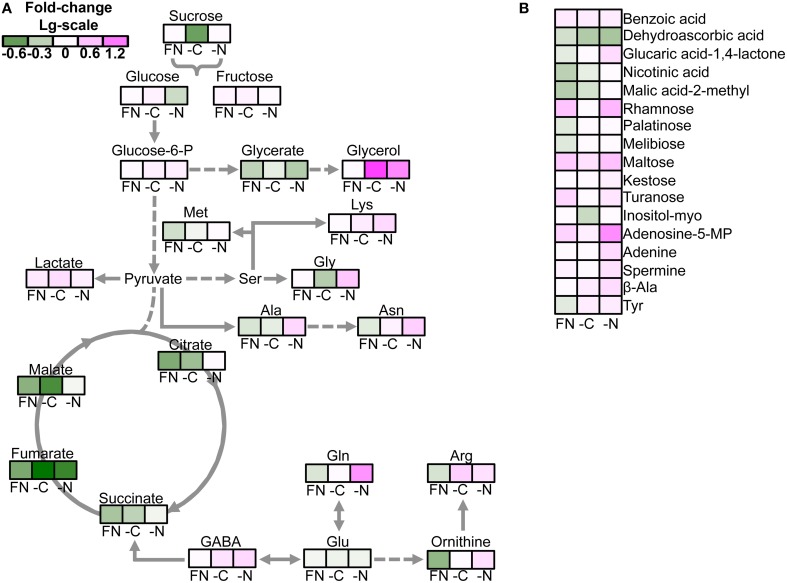
Figure 2.
Effect of media on the metabolite profile of gat1 compared to ws. The false color heat-map of the fold-changes in the levels of metabolite between gat1 and ws under FN, low C, and N media represented in the view of major metabolic pathways (A) and the rest of metabolites (B). Only significant changes between the genotypes according to the Student's t-test with confidence interval 95% are presented. Data are fold-change of means (n = 4) in Log10-scale.

