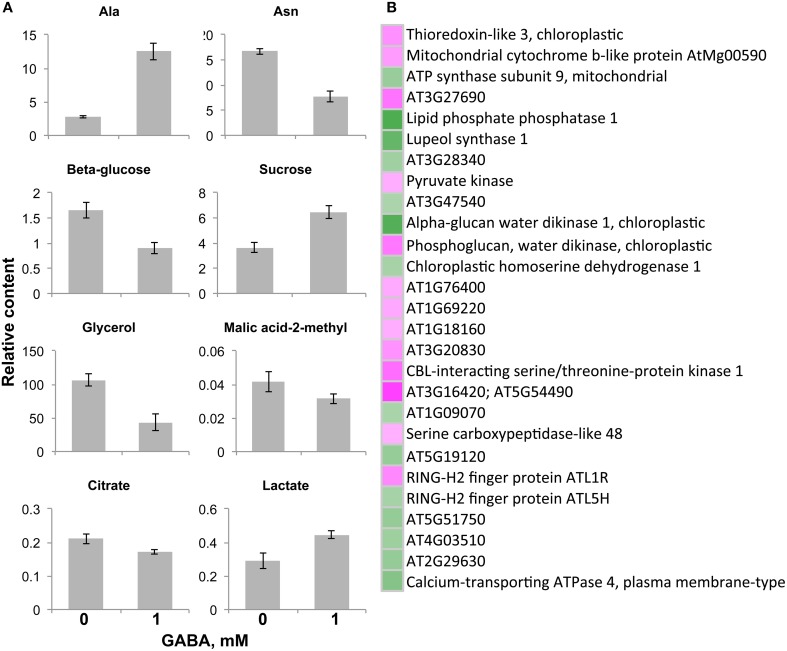
Figure 5.
Significantly changed metabolite content and gene expression levels in the gat1 samples in respect to 1 mM GABA treatment under low C medium. Bar graphs (A) represent a relative content of metabolites (Y axis) after normalization by fresh weight and standard ribitol. Data are mean (n = 4) ± SD. Statistical significance was tested with Student's t-test, pBONFERRONI ≤ 0.05. False color heat-map (B) represents fold-changes in the levels of metabolic genes expression between 1 mM GABA-treated samples and untreated samples under low C medium. Only significantly changed (pFDR ≤ 0.05, 4 times fold-change) and functionally annotated metabolic genes are presented.

