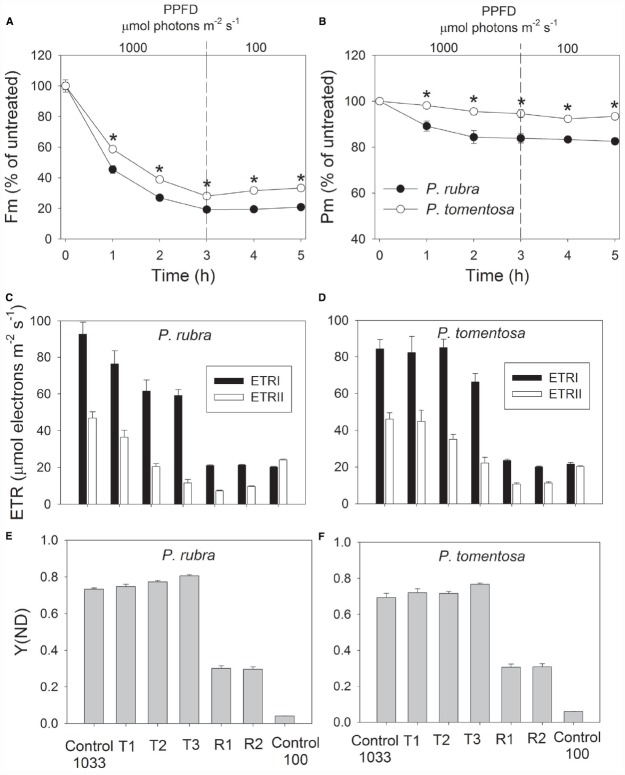
FIGURE 3.
Changes in Fm (A), Pm (B), ETR (C,D), and Y(ND) (E,F) in Psychotria rubra and Pometia tomentosa during treatment at 25°C and 1000 μmol photons m–2 s–1 and subsequent recovery at 100 μmol photons m–2 s–1. T1, T2, and T3 represent the data after high light treatment for 1, 2, and 3 h, respectively. R1 and R2 represent the data after recovery at low light for 1 and 2 h, respectively. Control 1033 and Control 100 represent the data measured at 1033 and 100 μmol photons m–2 s–1 before treatment, respectively. The means ± SE were calculated from six independent plants. Asterisks indicate significant differences between Psychotria rubra and Pometia tomentosa.

