
FIGURE 6.
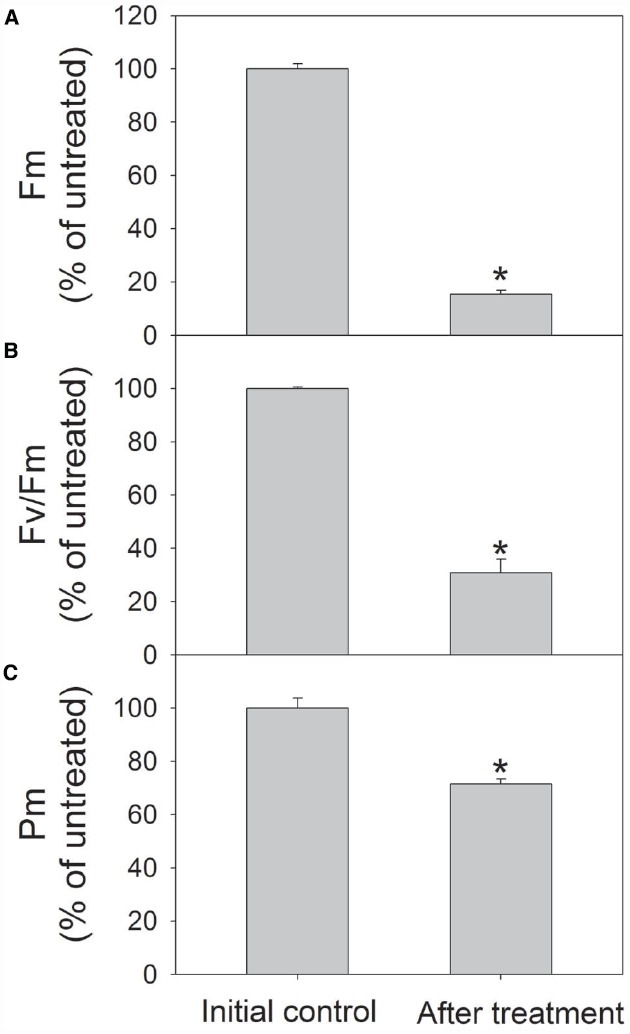
Changes in Fm (A), Fv/Fm (B), and Pm (C) in Pittosporopsis kerrii after exposure to 2000 μmol photons m–2 s–1 for 4 h. The means ± SE were calculated from six independent plants. Asterisks indicate significant differences between initial control and after treatment.