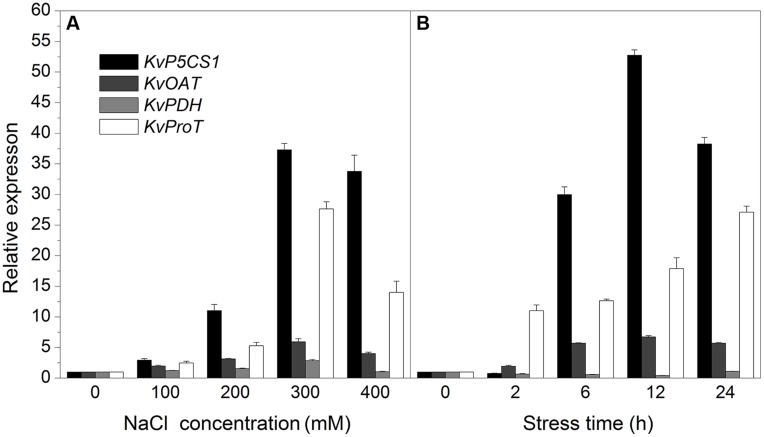
FIGURE 3.
The expression analysis of KvP5CS1, KvOAT, KvPDH, and KvProT in leaves of Kosteletzkya virginica under salt stress. (A) Salt concentration gradient treatments; (B) Time-course treatments. Each data point represents the average of three replications and the error bars represents standard deviation based on three replications.

