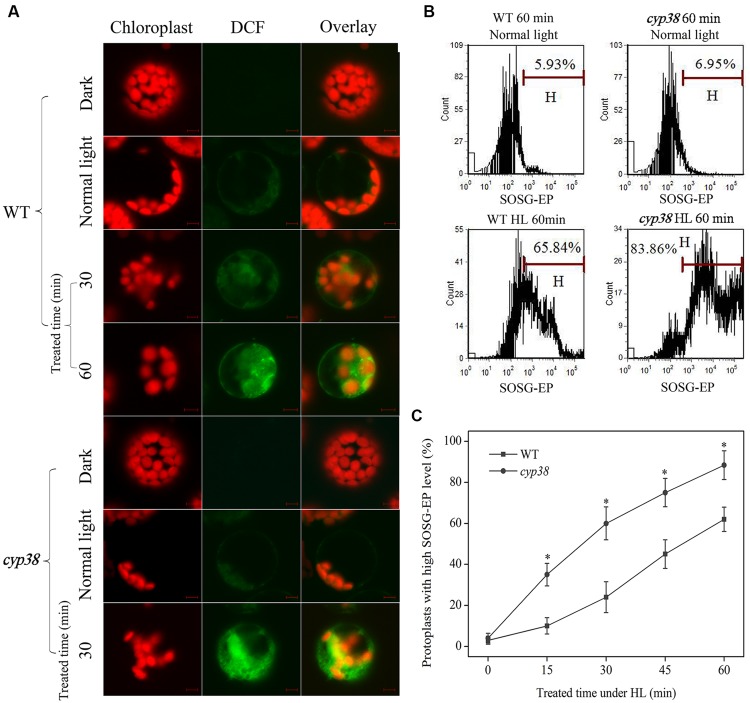
FIGURE 3.
Changes in ROS level under HL treatment. (A) Sub-cellular localization of HL-induced ROS production. Protoplasts from different plants were treated with or without HL for the indicated time period, then incubated with H2DCFDA (at a final concentration of 5 μM) for 30 min at room temperature, and observed using LCSM as described in materials and methods. Protoplasts derived from WT and cyp38 mutant without HL treated were kept in dark and normal light as controls. Other protoplasts were treated with HL (2000 μmol photons m-2 s-1) up to 60 min. Chloroplast autofluorescence is false colored red, and DCF fluorescence is false colored green. Scale bars = 10 μm. (B) Analysis of 1O2 in HL-treated WT and cyp38 protoplasts by flow cytometry using fuorescence probe SOSG. The marker bar H was set to indicate the cells with high fuorescence effux. SOSG-EP effux was measured by counting cells in the H region of the plot. (C) Kinetics of changes in 1O2 levels by flow cytometry analysis in WT and cyp38 protoplasts under HL treatment. Asterisks indicate a signifcant difference from the control by t-test: ∗P < 0.05.

