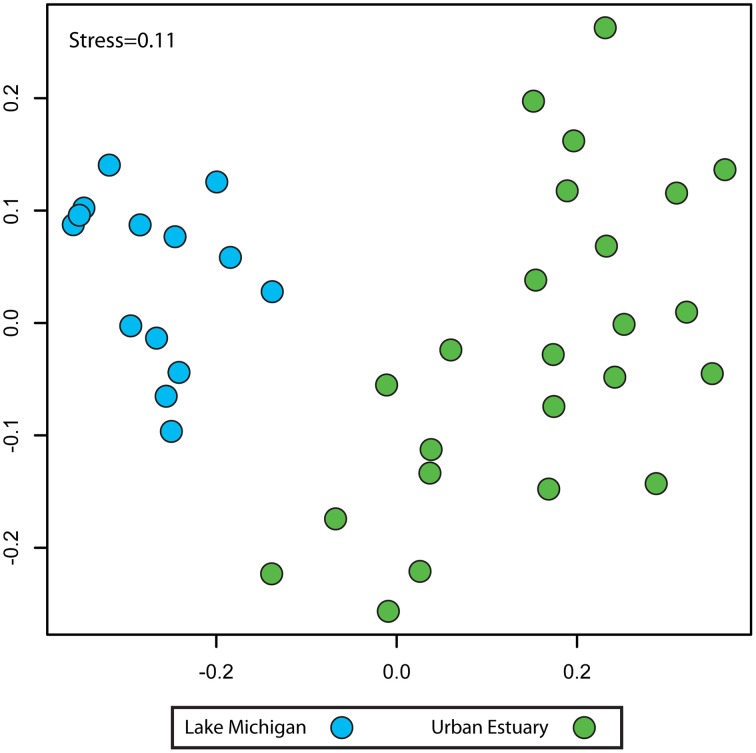
Figure 3.
Non-metric multidimensional scaling plot indicating the community composition relationships (Bray-Curtis similarity) between the Urban Estuary (green) and Lake Michigan (blue) samples. Community composition is based on the grouping of sequences by taxonomic assignment to genus and compiled as the relative contribution of each taxon to the community.

