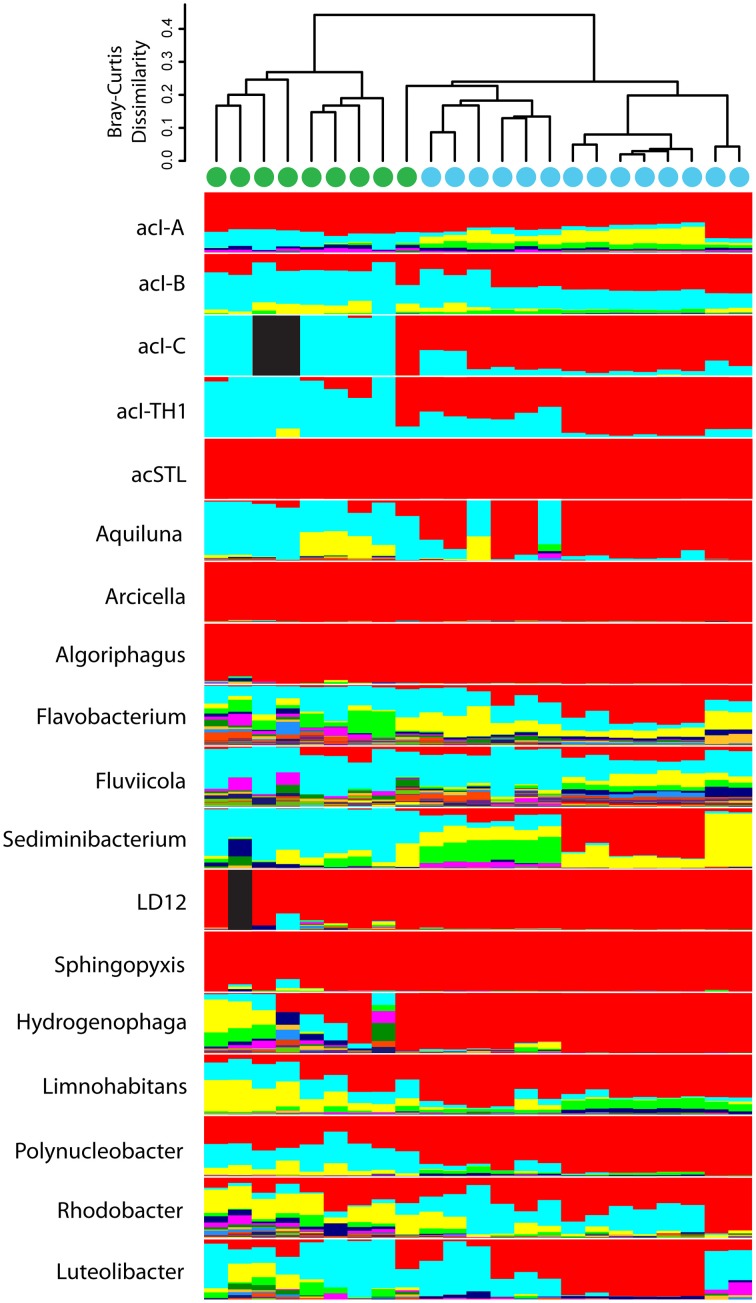
Figure 5.
Oligotype composition within each freshwater bacterial genus/lineage among samples is indicated in stacked bar plots. The relationship of the oligotype composition in each sample is depicted with a cluster dendrogram based on Bray-Curtis dissimilarity among samples. Fully black bars indicate no sequences were recovered from that genus/lineage in that sample. Samples were clustered via an unweighted pair group method with arithmetic mean calculation. Samples collected from the urban estuary are labeled with a green circle while those collected from Lake Michigan are labeled with a blue circle.

