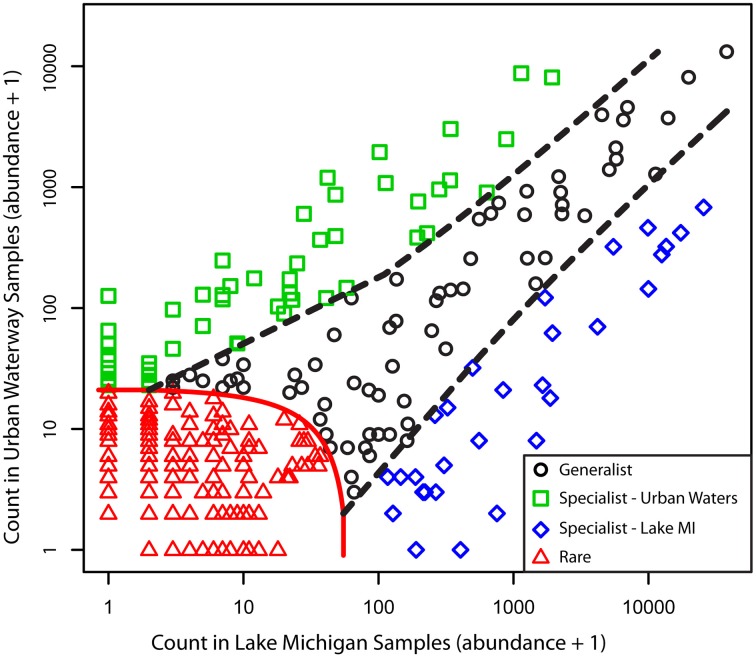
Figure 6.
Classification results for oligotype distributions between the urban estuary and Lake Michigan samples. Specialization was set with a threshold of K = 0.75, a coverage limit = 30, and P = 0.01/351. Classification status is indicated by point color and shape. The specialist and rarity thresholds are indicated by dotted lines.

