
Fig. 3.
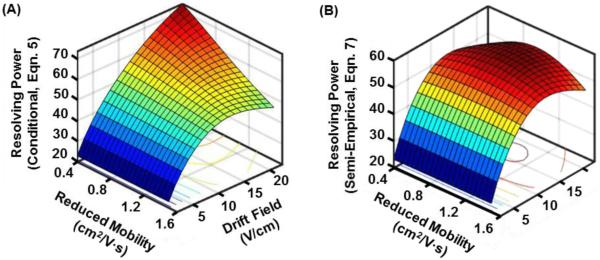
3D resolving power curves projecting the predicted resolving power for singly-charged ions across a range of drift fields and ion mobilities. (A) Conditional resolving power (equation 5), and (B) semi-empirical resolving power via. eqn. (7) using coefficient expressions obtained in this current work. Both expressions assume 4 Torr drift gas pressure with an initial gate width of 200 µs. As compared with the conditional resolving power, the semi-empirical resolving power predicts a relatively narrow drift field range for accessing the optimal resolving power, as well as a more uniform resolving power response for a wide range of ion species.