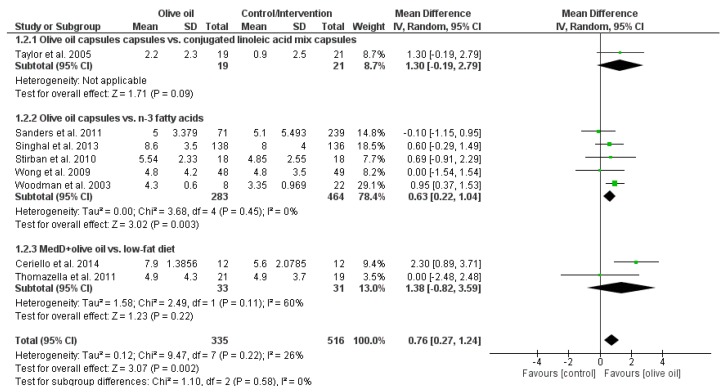
Figure 5.
Effects of olive oil on flow-mediated dilatation (%, absolute percentage). Forest plot showing pooled mean differences with 95% confidence intervals (CI) for eight randomized controlled diets. For each study, the shaded square represents the point estimate of the intervention effect. The horizontal line joins the lower and upper limits of the 95% CI of these effects. The area of the shaded square reflects the relative weight of the study in the respective meta-analysis. The diamond at the bottom of the graph represents the pooled MD with the 95% CI for all study groups. Please note that the labeling of the X-axis has been switched as compared to Figure 3 and Figure 4, respectively, since for flow-mediated dilatation an increase is considered to be favorable. MedD = Mediterranean diet.

