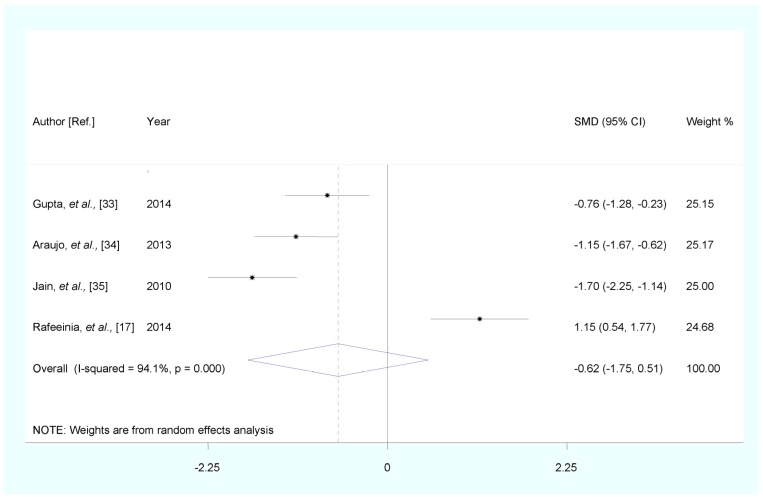
Figure 4.
Forest plot of standard mean difference (SMD) with corresponding 95% confidence interval (CI) of studies on zinc levels in severe preeclampsia (PE) and healthy pregnancy controls. The size of grey box is positively proportional to the weight assigned to each study, and horizontal lines represent the 95% CIs.

