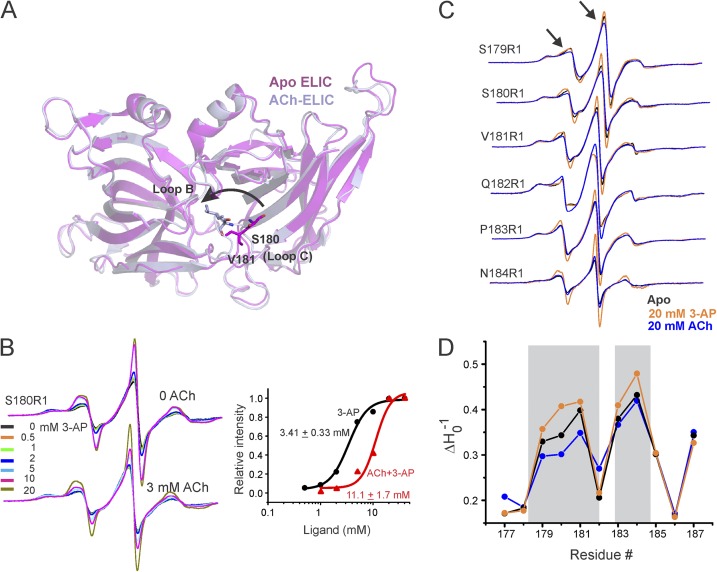
Figure 1.
Agonist- and antagonist-evoked conformational changes in the ELIC-ECD. (A) Superimposition of apo-ELIC (PDB accession no. 3RQU) and ACh-ELIC (PDB accession no. 3RQW) structures shows an inward (counterclockwise) motion of loop C. (B) Concentration-dependent changes in the EPR line shape and amplitude measured at position Ser180 in the presence and absence of 3 mM ACh. In each case, the spectra are normalized to the total number of spin (see Materials and methods). A plot of peak amplitude (of the central line) as a functional 3-AP concentration (right). (C) Spin-normalized CW-EPR spectra of representative loop C residues in apo state and in the presence of ACh or 3-AP. (D) Changes in probe mobility of loop C positions in the three conditions. The gray boxes highlight regions displaying prominent changes.

