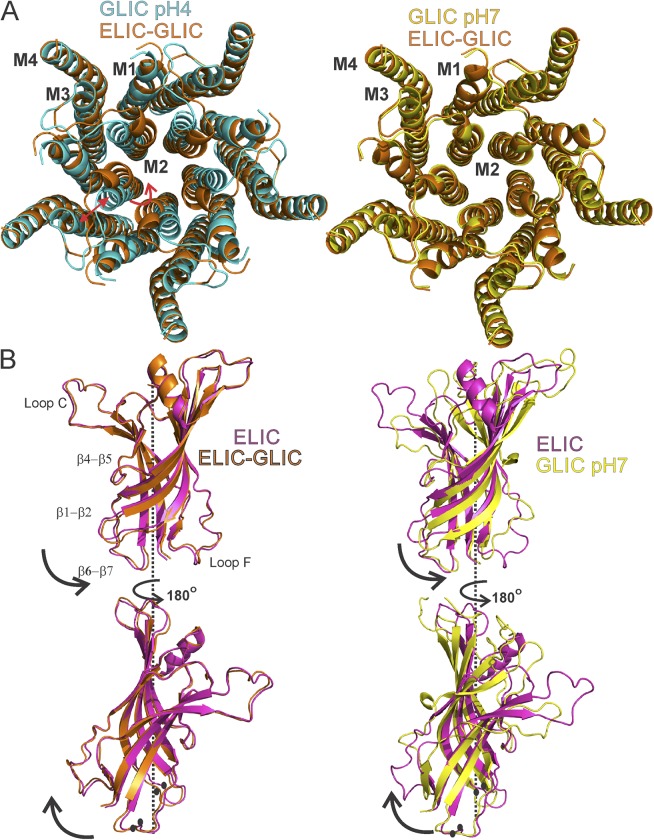
Figure 3.
Structural differences in the ELIC-GLIC chimera compared with ELIC and GLIC. (A) Top view of TMDs comparing the ELIC-GLIC chimera with GLIC structures in the closed (pH 7.0; PDB accession no. 4NPQ) and open (pH 4.0; PDB accession no. 4HFI) forms. Red arrows highlight positional differences. (B) Superimposition of the ELIC (PDB accession no. 2YN6), GLIC (pH 7.0; PDB accession no. 4NPQ), and ELIC-GLIC structures at the level of the ECD. The ECD pentamer comprising of residues 11–200 was superimposed at the Cα level. Black arrows show the direction of twist from ELIC to ELIC-GLIC (left) and from ELIC to GLIC (right). Key regions showing difference in position are marked by black circles.

