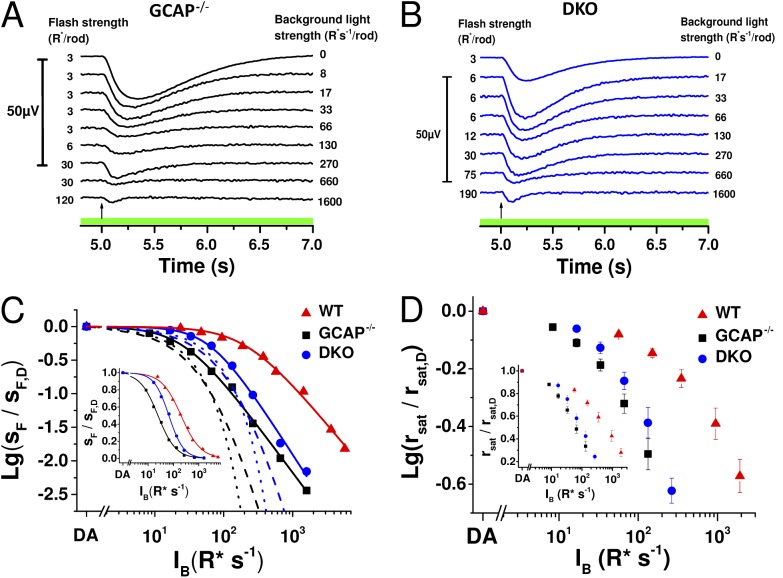
Figure 1.
Deletion of recoverin narrows the operating range of GCAP−/− rods. Dim-flash responses (in microvolts; see scale bar on the left) recorded in darkness and during steps of light from isolated GCAP−/− (A; IB range: 8–1,600 R* s−1 per rod) and DKO (B; IB range: 17–1,600 R* s−1 per rod) mouse retinas. Flash strengths in darkness and under each background are indicated by numbers preceding each response, and the background light intensity is given on the right. Timing of the flash, 5 s after the background onset, is indicated by an arrow in each panel. (C) Sensitivity as a function of background light intensity (IB), normalized to sF,D, for a representative retina in GCAP−/− (black squares), DKO (blue circles), and WT (red triangles) mice. Smooth curves plot Eq. 1 with I0 = 27 R* s−1 per rod, n = 1.4; I0 = 65 R* s−1 per rod, n = 1.6; and I0 = 218 R* s−1 per rod, n = 1.2 in GCAP−/−, DKO, and WT mouse, respectively. Dotted and dashed lines plot Eqs. 2 and 3, respectively, for GCAP−/− (black) and for DKO (blue) mice. The inset shows the sensitivity data in linear scale and best-fitting functions (Eq. 1) with parameter values: I0 = 24 R* s−1 per rod, n = 1.2; I0 = 66 R* s−1 per rod, n = 1.5; and I0 = 199 R* s−1 per rod, n = 1.1 in GCAP−/−, DKO, and WT mouse, respectively. (D) Saturated response amplitude (rsat) normalized to the rsat in darkness as a function of IB in WT (red), GCAP−/− (black), and DKO (blue) mouse rods. Error bars represent mean ± SEM (n = 7).

