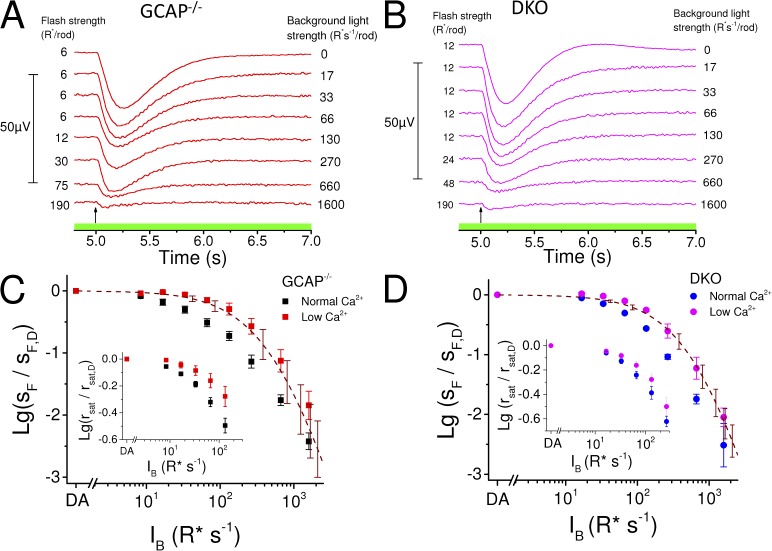
Figure 4.
Low Ca2+ exposure eliminates sensitivity regulation and minimizes the operating range of GCAP−/− and DKO mouse rods. Dim-flash responses (in microvolts; see scale bar on the left) in darkness and during steps of light in GCAP−/− (A; IB range: 17–1,600 R* s−1 per rod, indicated on the right side of each response) and DKO (B; IB range: 17–1,600 R* s−1 per rod, indicated on the right side of each response) mouse rods in low Ca2+ solution. Flash strengths ranged from 6 to 190 R* per rod and from 12 to 190 R* per rod in GCAP−/− and DKO mice, respectively, as indicated by the numbers preceding each response. Timing of the flash, 5 s after the background onset at t = 0 s, is indicated by an arrow. Average (±SEM) sensitivities normalized with sF,D as a function of background light intensity (IB) are plotted for four GCAP−/− (C) mouse retinas in normal (black marks) and low (red marks) Ca2+ solution and for three DKO (D) mouse retinas in normal (blue marks) and low (magenta marks) Ca2+ solution. Dashed lines plot Eq. 3 under low Ca2+ conditions for GCAP−/− (C) and DKO (D) rods (error bars represent mean ± SEM). Insets in C (GCAP−/−) and D (DKO) show rsat/rsat,dark as a function of IB in normal (black, GCAP−/−; blue, DKO) and low Ca2+ (red, GCAP−/−; magenta, DKO). Mean ± SEM (n = 7).

