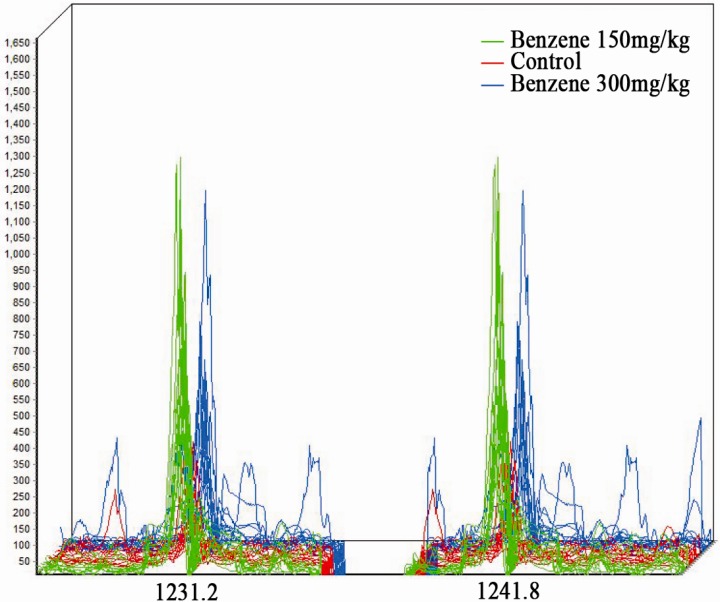
Figure 2.
Three-dimensional m/z ratio-intensity maps showing significantly different protein spectra between the three groups. Peptides with molecular weights (MWs) of 1231.2 Da and 1241.8 Da were the two that differed most significantly between control and exposure groups. Green curve, benzene 150 mg/kg; red curve, control group; blue curve, benzene 300 mg/kg.

