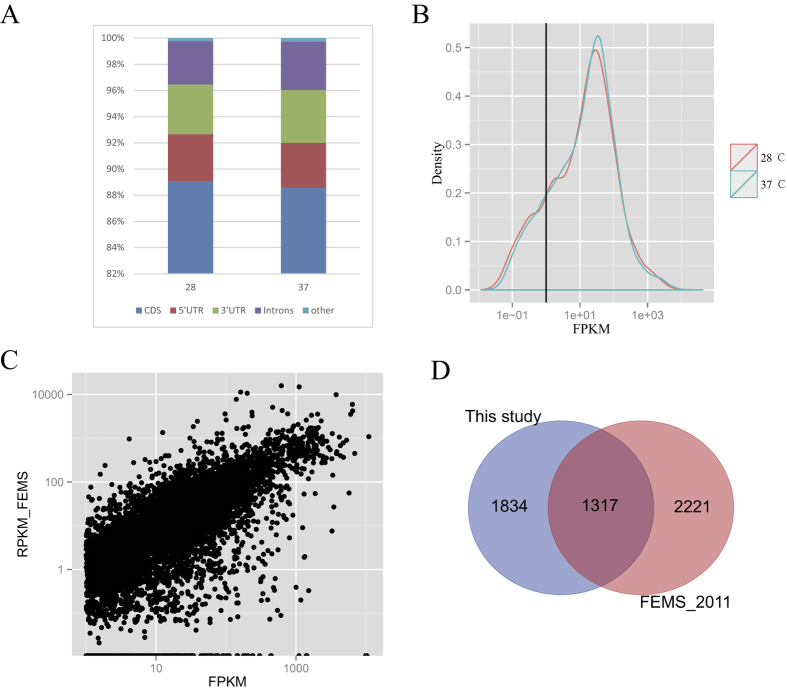
Figure 1. Transcriptome data of A. flavus at 28 °C and 37 °C.
(A) RNA-Seq mapping statistics on different gene region. (B) Diagram of the FPKM value of genes. (C) Comparison of RNA seq data with Ref. 25 on 37 °C sample. (D) The number of DEGs identified by the two RNA seq dataset.

