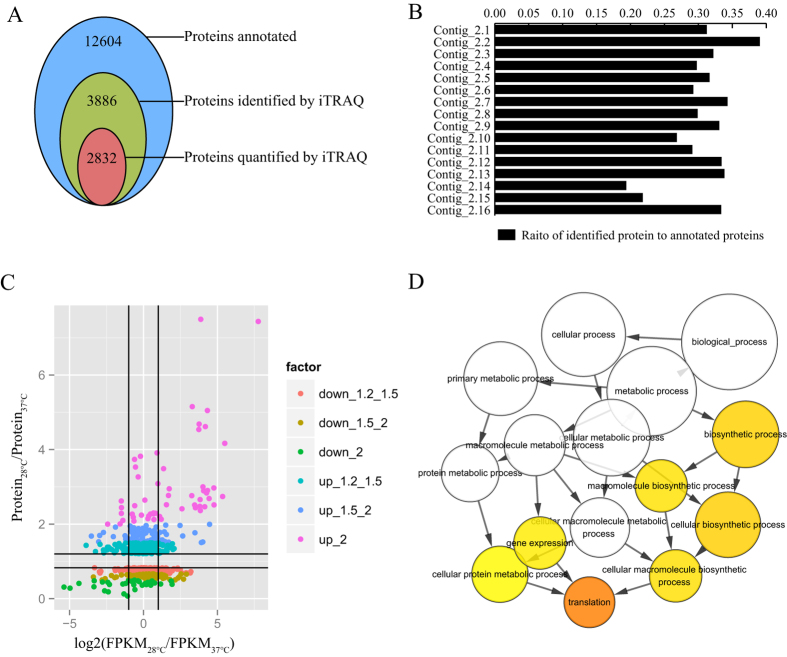
Figure 2. Annotation of proteome data.
(A) The number of proteins identified and quantified by the iTRAQ method. (B) The number of protein identified were mapped into 16 contigs. (C) The differentially expressed proteins under temperature changes. (D) The GO term enrichment of the up-regulated proteins under 28 °C.

