Figure 1.
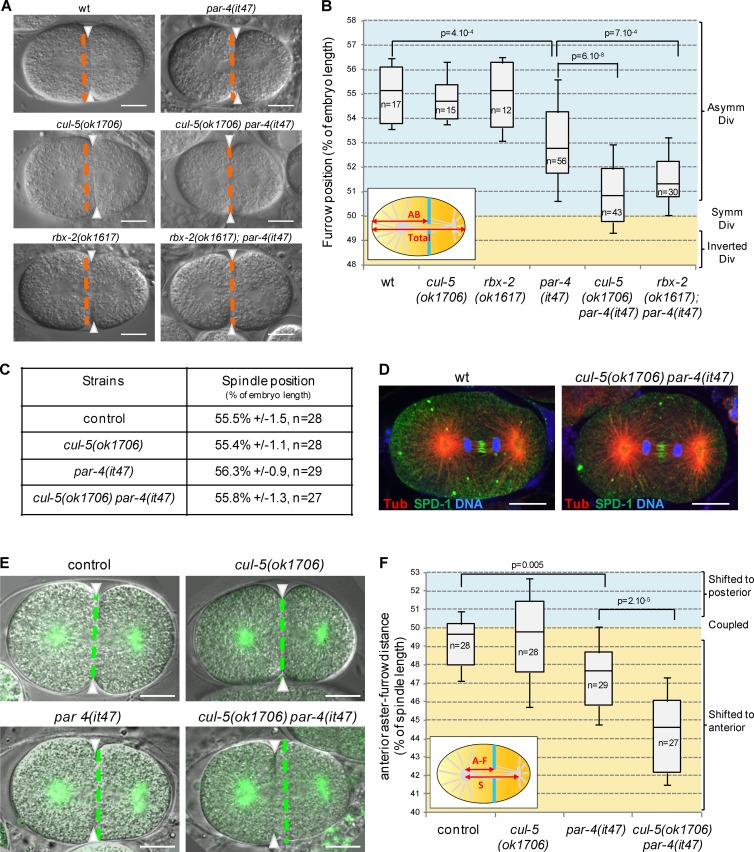
CUL-5/RBX-2 and PAR-4 regulate cytokinetic furrow position. (A and B) The furrow is shifted toward the anterior in cul-5(ok1706) par-4(it47) and rbx-2(ok1617); par-4(it47) embryos. DIC images (A) and quantification of furrow position (B) in dividing one-cell embryos of the indicated genotypes. Furrow position was measured when the furrow spanned the entire embryo. Orange dashed lines correspond to the embryo center and arrowheads to furrow position. As depicted in the inset (B), furrow position is the distance between the anterior pole and the furrow (AB size) expressed as a percentage of total embryo length (0% corresponds to the anterior pole, 100% to the posterior pole). See also Fig. S1 and Video 1. (C) Position of the spindle center at the onset of cytokinesis in one-cell embryos of the indicated genotypes (all strains also express an α-tub::YFP transgene). (D) Localization of the spindle midzone protein SPD-1 and of DNA during anaphase is normal in cul-5(ok1706) par-4(it47) embryos. Confocal section of wild-type and cul-5(ok1706) par-4(it47) one-cell anaphase embryos stained for α-tubulin (red), SPD-1 (green), and DNA (blue). More than 10 anaphase embryos per genotype were observed and representative images are shown. (E and F) Furrow and spindle positions are uncoupled in cul-5(ok1706) par-4(it47) embryos. Superposed confocal sections and DIC images (E) and quantification of furrow/spindle coupling (F) in dividing one-cell embryos of the indicated genotypes (all strains also express an α-tub::YFP transgene [green]). Green dashed lines correspond to the spindle center and arrowheads to furrow position. As depicted in the inset (F), the distance between the anterior aster and the furrow (A-F) was measured during ingression and expressed as a percentage of spindle length (50% corresponds to the furrow position being coupled with spindle center, below 50% corresponds to a shift of the furrow toward the anterior, and above 50% corresponds to a shift toward the posterior). See also Video 2.In all images, embryos are oriented with the anterior to the left. Bars, 10 µm. P-values from Student’s t test.

