Figure 1.
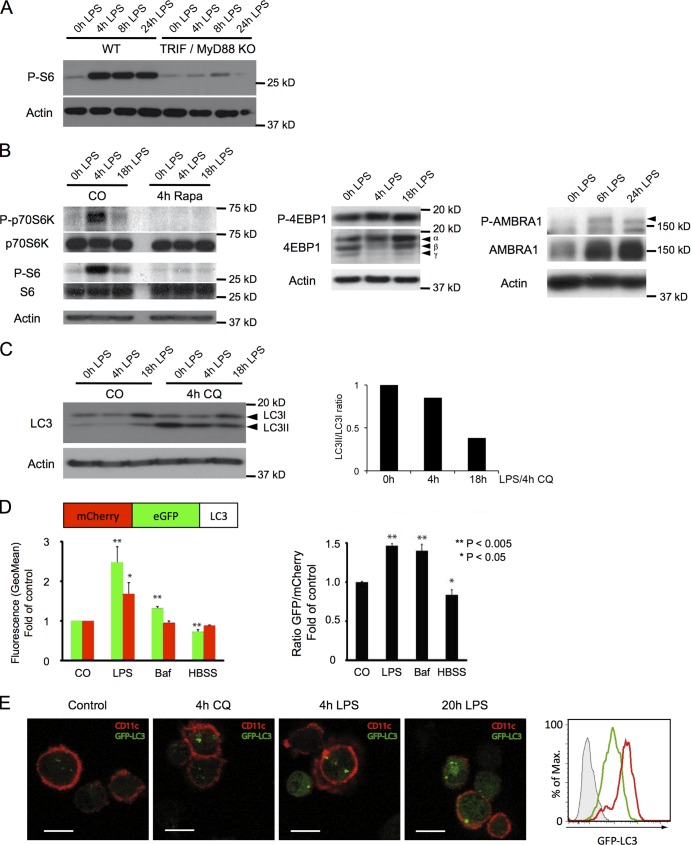
The mTOR pathway is activated and autophagy is inhibited in DCs upon LPS exposure. (A) WT or MyD88- and TRIF-deficient (KO) DCs were stimulated with LPS as indicated, and S6 phosphorylation was analyzed by immunoblot. (B) DCs were stimulated with LPS and treated or not with rapamycin (4 h) as indicated. Cell lysates were analyzed by immunoblot for phosphorylation of p70-S6 kinase and S6 and total levels of p70, and S6 and actin served as controls (left). DCs were stimulated as indicated with LPS, and lysates were analyzed by immunoblot for phosphorylation of 4E-BP1 (Thr37/46; middle) and AMBRA1 (right; P-AMBRA1 is indicated by an arrowhead). Note the shift of 4-EBP1 from the nonphosphorylated γ form to the partially phosphorylated (hypophosphorylated) β and the hyperphosphorylated α forms (middle). (C) DCs were stimulated with LPS for the indicated time, and CQ was added for 4 h where specified. Cell lysates were analyzed by immunoblot for LC3 and actin (left). LC3I, nonlipidated form; LC3II, lipidated form. The relative LC3II accumulation was quantified using ImageJ (National Institutes of Health; right). The data shown are from a single representative experiment out of seven repeats. (D) DC maturation induces autophagy inhibition. DCs were transfected with mRNA encoding for mCherry-GFP-LC3 and incubated for 8 h in the presence of LPS or bafilomycin or starved in HBSS. GFP and mCherry fluorescence in CD11c+ cells was assessed by FACS (left). Plotted is the ratio of GFP fluorescence (fold over control) versus mCherry fluorescence (fold over control; right). Mean and SEM from three independent experiments and p-values (Student’s t test) are shown. (E) Autophagy inhibition is revealed by accumulation of GFP-LC3. DCs from GFP-LC3 transgenic mice were treated or not for 4 or 20 h with LPS or for 4 h with CQ, stained for CD11c, and analyzed for GFP fluorescence (left). B6 WT DCs (histogram filled with gray) or GFP-LC3 DCs were stimulated (red) or not (green) with LPS for 20 h, and GFP fluorescence was analyzed in CD11c+ cells by FACS (rightmost panel). The data shown are from a single representative experiment out of three repeats. Bars, 10 µm.

