Figure 2.
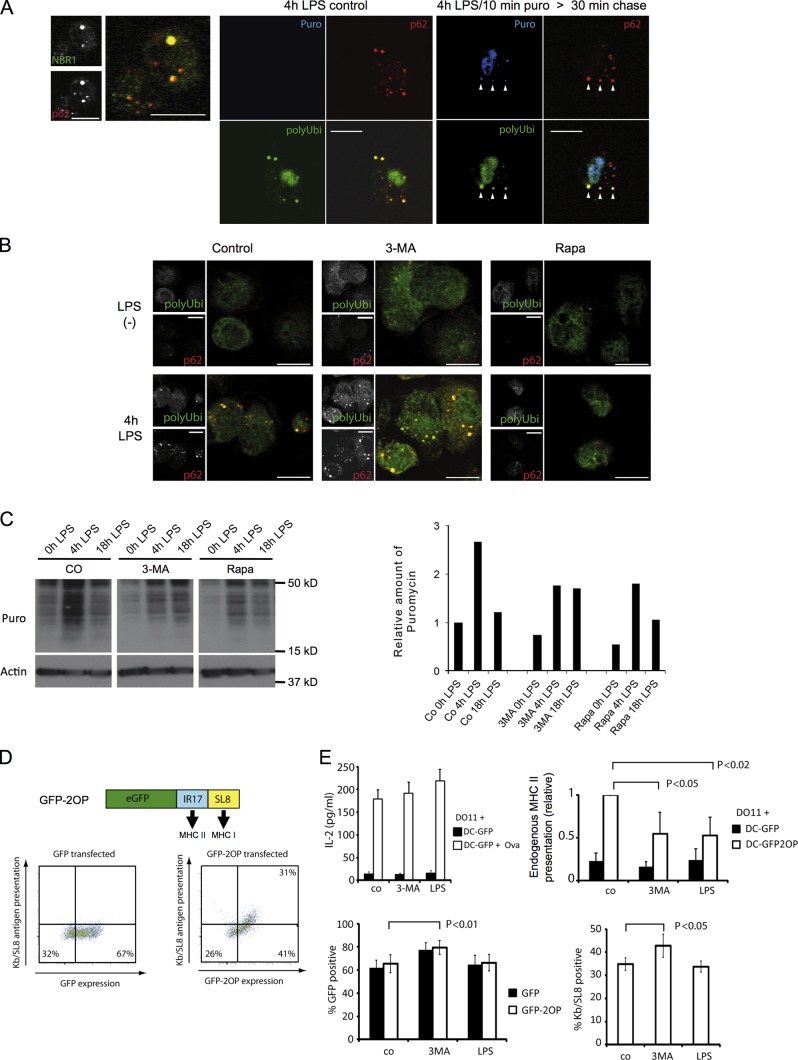
Autophagy inhibition by DC activation leads to the aggregation of endogenous antigens in DALISs and down-regulation of MHC II presentation. (A) Immunofluorescence confocal microscopy (ICM) analysis for NBR1 and p62 was performed on LPS-stimulated DCs (left). LPS-stimulated DCs were given a 10-min pulse of 0.1 µg/µl puromycin (right) or left untreated (middle). 30 min later, cells were detergent extracted and fixed. Polyubiquitinylated proteins (polyUbi), p62, and puromycin-marked (Puro) proteins were analyzed by ICM. Arrowheads indicate the rapid localization of puromycin-labeled proteins with p62 in DALISs. (B) ICM analysis of polyubiquitinylated proteins and p62 was performed on LPS-stimulated (4 h) or control DCs, treated or not for 4 h with 3-MA or rapamycin. (A and B) Bars, 10 µm. (C) DCs were stimulated as indicated with LPS in the presence or absence of 3-MA or rapamycin and were given 1 µg/ml puromycin 10 min before harvesting and incorporation monitoring by immunoblot. Density quantification is shown on the right. The data shown are from a single representative experiment out of three repeats. (D) Schematic representation of the eGFP/double ovalbumin peptide (GFP-2OP) model antigen, containing the I-Ad–presented IR17 peptide (Ova 323–339) and the Kb-presented SL8 peptide (Ova 257–264). Representative FACS analysis (n = 4) of GFP fluorescence and Kb/SL8 antigen presentation (25D1 mAb) upon transfection of GFP or GFP-SL8 mRNA in CB6F1 DCs. (E, top left) GFP mRNA–transfected CB6F1 DCs were incubated with 0.3 µg/ml ovalbumin (delivered as immune complexes) alone or together with LPS or 3-MA for 8 h and used to stimulate DO.11 T cells. Mean and SEM from three independent experiments. (top right) CB6F1 DCs transfected for 8 h with eGFP or eGFP-SL8-OT2P mRNA were used to stimulate DO.11 T cells for 24 h. T cell activation was determined by IL-2 dosage. Mean and SEM from four experiments and p-values (Student’s t test) are shown. (bottom) CB6F1 DCs were transfected with GFP or with GFP-2OP mRNA and cultured for 8 h in the presence or absence of 3-MA or LPS, and antigen expression (% GFP positive) and Kb/SL8 surface appearance (% Kb/SL8 positive by 25D1 staining) were measured. Mean and SEM from three independent experiments.

