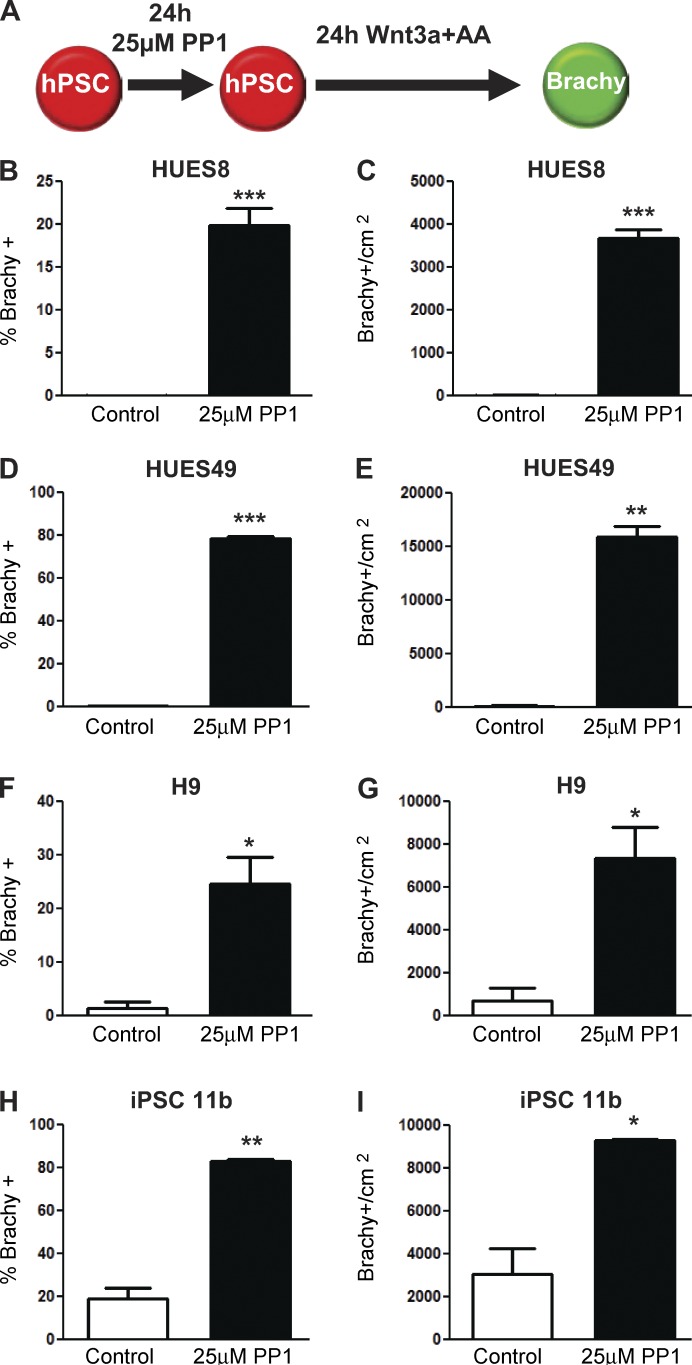
Figure 2.
PP1 treatment improves differentiation capacity across hPSC lines. (A) Schematic of directed differentiation of hPSCs into Brachy+ cells after no treatment (control) or a 24-h 25 µM PP1 treatment. (B–I) Percentages and absolute numbers of control and PP1-treated hPSCs differentiating into Brachy+ cells in the HUES8 (B and C), HUES49 (D and E), H9 (F and G), and iPSC 11b (H and I) hPSC lines. Error bars indicate SEM of two replicates (HUES49, H9, iPSC11b) or four replicates (HUES8). *, P ≤ 0.05; **, P ≤ 0.01; ***, P ≤ 0.001.

