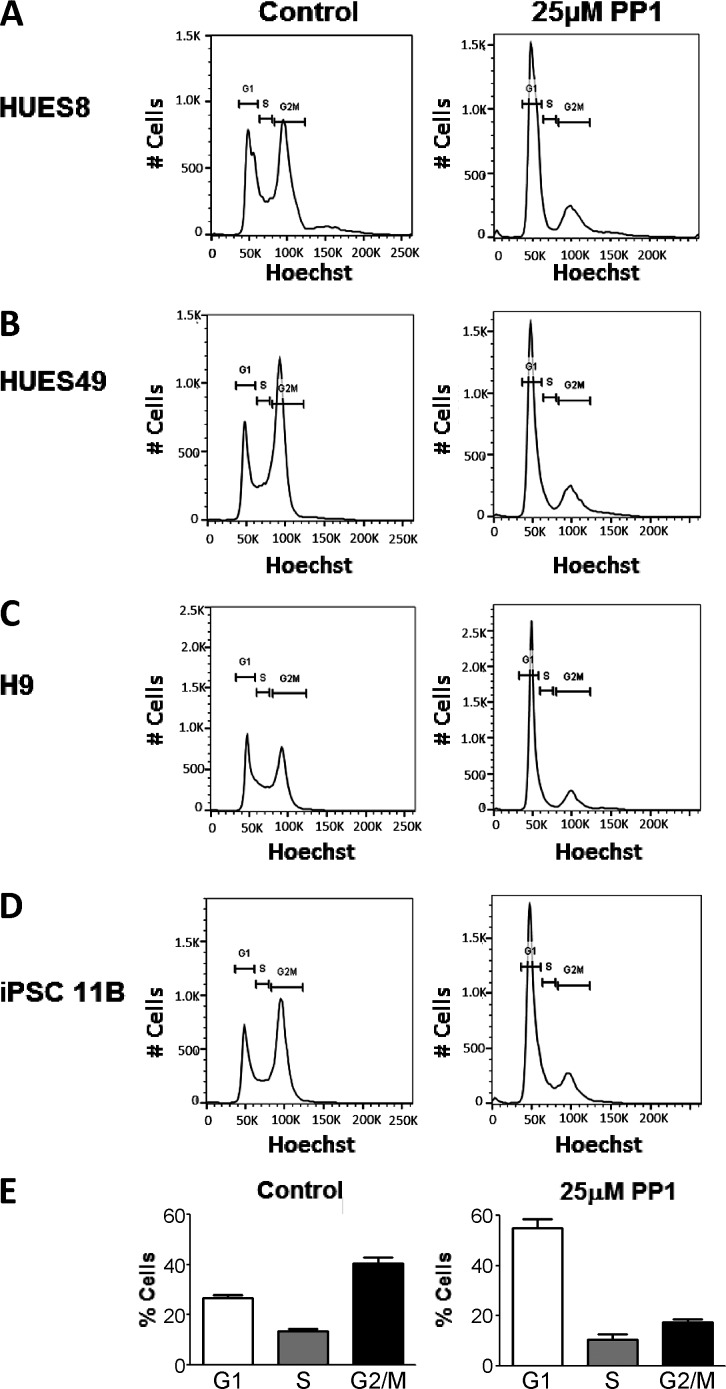
Figure 3.
PP1 treatment enriches cells in G1 across hPSC lines. Distribution of hPSCs in the G1, S, and G2/M phases of the cell cycle after no treatment (control) or a 24-h 25 µM PP1 treatment in the HUES8 (A), HUES49 (B), H9 (C), and iPSC 11b (D) hPSC lines. (E) Mean percentage of hPSCs across all cell lines in the G1, S, and G2/M phases of the cell cycle after no treatment (control) or a 24-h 25 µM PP1 treatment.

