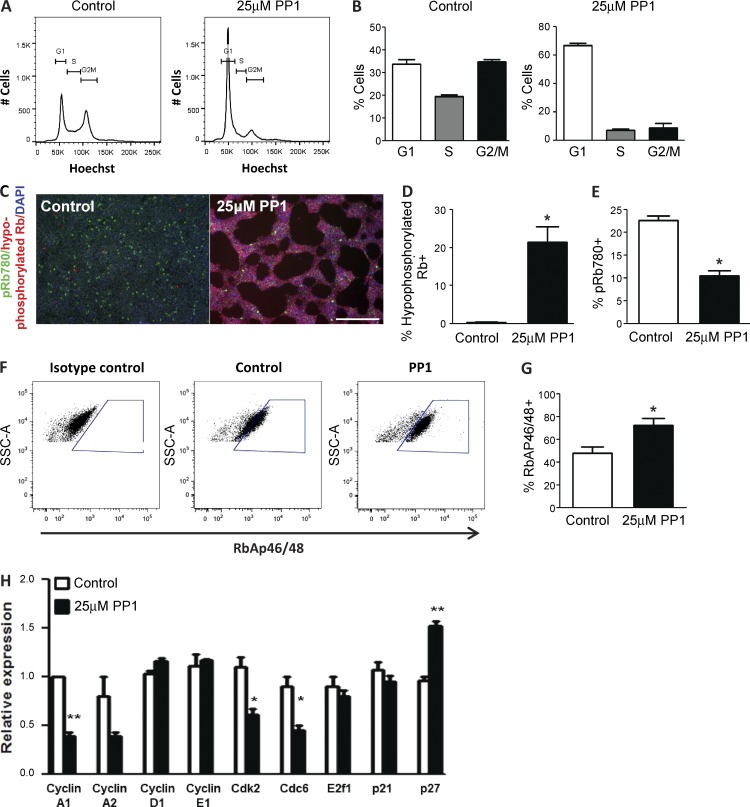
Figure 4.
PP1 treatment regulates the cell cycle and enhances the activity of Rb in hPSCs. (A and B) Distribution (A) and percentage (B) of HUES6 hPSCs in the G1, S, and G2/M phases of the cell cycle after no treatment (Control) or a 24-h 25 µM PP1 treatment. (C) Immunostaining for the active hypophosphorylated Rb (red) and inactive phosphorylated pRb780 (green) in control and PP1-treated hPSCs. Bar, 200 µM. (D and E) Percentage of hPSCs expressing hypophosphorylated Rb (D) and hyperphosphorylated Rb (E; pRb780) after no treatment (Control) or a 24-h 25 µM PP1 treatment. (F and G) Flow cytometry analysis of the percentage of hPSCs expressing the retinoblastoma-associated protein 46/48 (RbAP46/48) after no treatment (Control) or a 24-h 25 µM PP1 treatment. (H) Relative expression levels of cell cycle–regulated genes in PP1-treated hPSCs compared with untreated controls. Error bars indicate SEM of 2–3 replicates. *, P ≤ 0.05; **, P ≤ 0.01.

