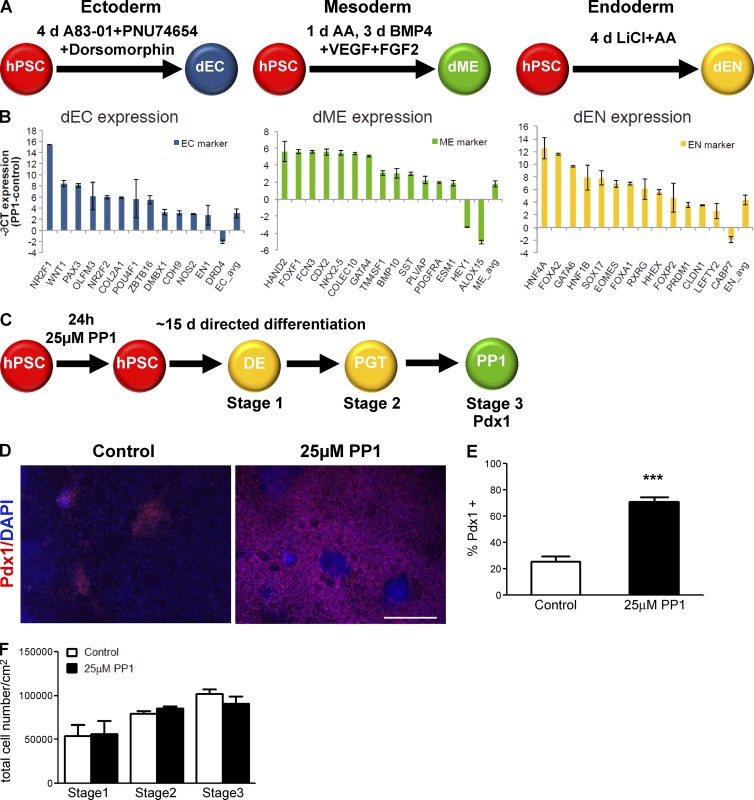
Figure 6.
PP1 treatment improves the specificity of differentiation of hPSCs. (A) Schematic of directed differentiation of HUES6 hPSCs into ectoderm (dEC, blue), mesoderm (dME, green), and endoderm (dEN, yellow) populations. (B) Difference in mean expression between PP1-treated and control samples, −∂CT = −(CTPP1 − CTCONTROL), for selected ectoderm (left), mesoderm (center), and endoderm (right) marker genes after directed differentiation into the three germ layers. All markers with −∂CT ≥ 1.9 or ≤ −1.9 are displayed, where −∂CT = 2 represents a fourfold increase in expression for PP1-treated versus control samples. The mean difference in expression for all ectoderm, mesoderm, and endoderm markers on the Scorecard panel (Life Technologies) is displayed as the rightmost bar. Error bars indicate standard deviation in difference in expression of two replicates. (C) Schematic of stepwise differentiation into pancreatic progenitor (PP1; Pdx1+) cells following a 15-d directed differentiation protocol after no treatment (control) or a 24-h 25 µM PP1 treatment. (D) Immunostaining for Pdx1 in control and PP1-treated cultures after directed differentiation. Bar, 200 µM. (E) Percentage of cells differentiating into Pdx1+ pancreatic progenitor cells in control and PP1-treated cultures. (F) Total cell numbers in control and PP1-treated cultures through the three stages of directed differentiation. Error bars indicate SEM of 4–6 replicates. ***, P ≤ 0.001.

