Figure 3.
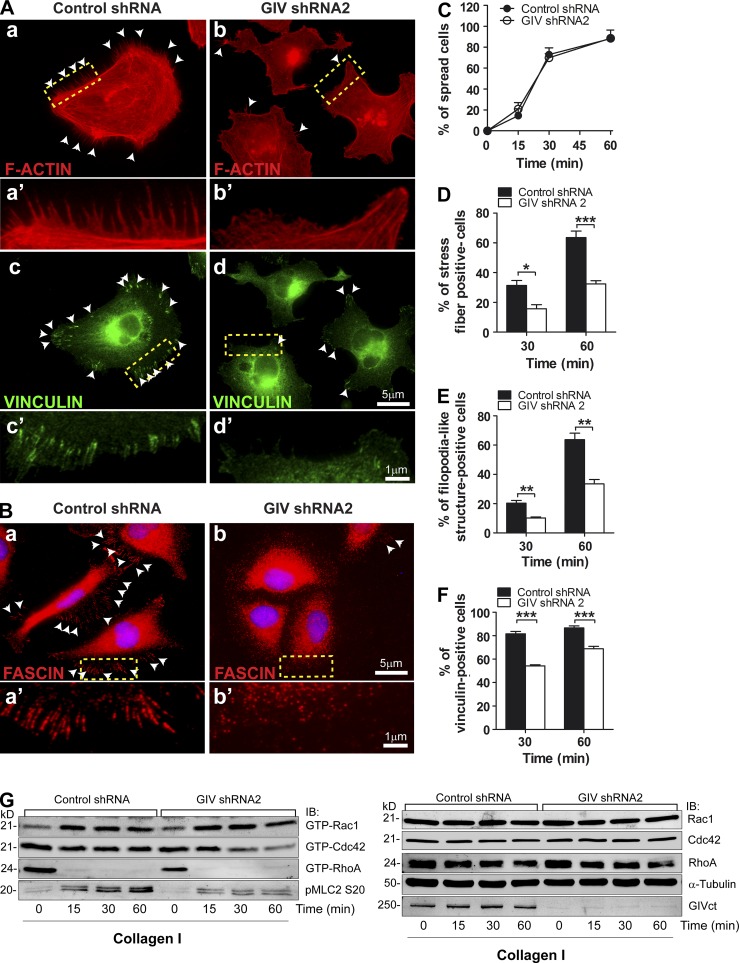
GIV depletion impairs actin cytoskeleton remodeling upon integrin stimulation. (A and B) MDA-MB-231 shRNA control (left) and GIV shRNA2 (right) cells were stimulated with collagen I as described in Fig. 2 B, except that the collagen I–coated surfaces were glass coverslips and that cells were fixed and stained for F-actin (phalloidin, red) and vinculin (green) in A and fascin (red) in B. Representative pictures of the cells 60 min after seeding are shown. A magnified view of the boxed areas in A (a, b, c, and d) and B (a and b) is shown in A (a′, b′, c′, and d′) and B (a′ and b′). White arrowheads highlight filopodia-like structures in (A, a and b, and B, a and b) and focal adhesions (defined as vinculin-positive structures) in A (c and d). The percentage of cells displaying stress fibers (D), filopodia-like structures (E), and focal adhesions (F) at 30 and 60 min as well as the proportion of spread cells (C) at 15, 30, and 60 min was calculated as described in Materials and methods. Results are depicted as mean ± SEM (error bars; n = 3; *, P < 0.05; **, P < 0.01; ***, P < 0.01). (G) MDA-MB-231 shRNA control and GIV shRNA2 cells were stimulated with collagen I as described in Fig. 2 B, and Rac1, Cdc42, and RhoA activity (GTP-Rac1, GTP-Cdc42, and GTP-RhoA) were determined using a pulldown assay as described in Materials and methods. MLC2 phosphorylation was determined by immunoblotting (pMLC2). Representative of at least four experiments.

