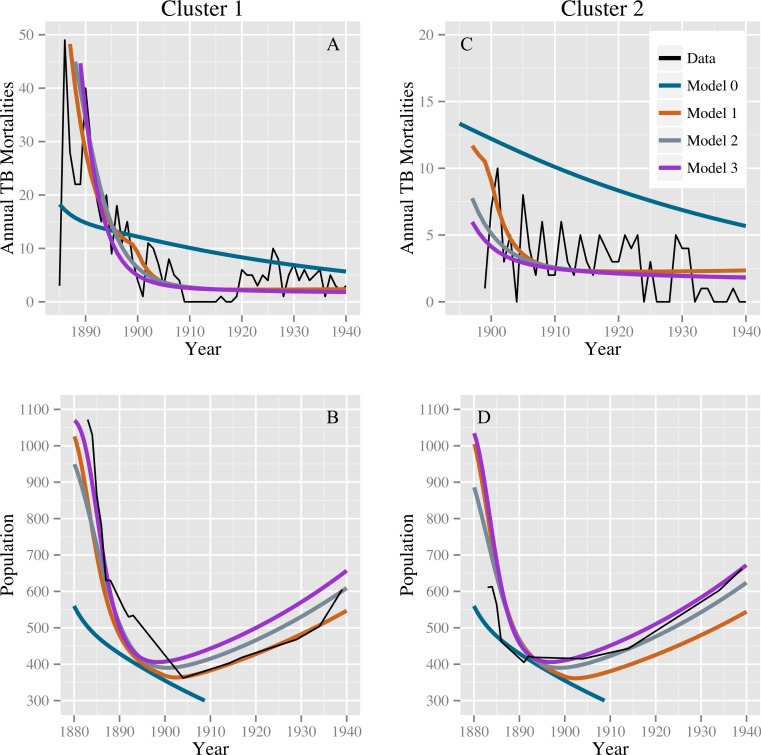
Figure 2. Model fits to the TB mortality time series and census data.
Model fits to the TB mortality time series and census data for clusters 1 and 2 on the left (A and B, respectively) and right (C and D, respectively), respectively, and for models 0, 1, 2, and 3. Model 0 yields an implausibly poor fit to the TB mortality time series and census data, while models 1, 2, and 3 confer better fits, capturing the characteristic demographic decline and rise.

