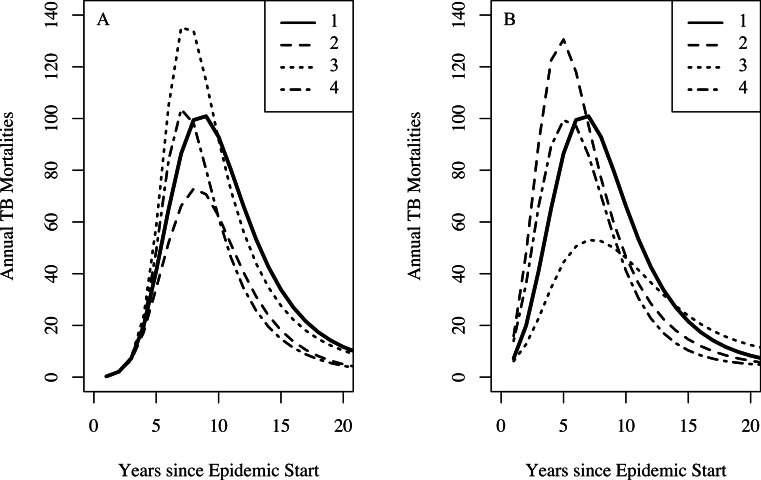
Figure 5. The effect of combinations of famine-related parameters on TB dynamics.
Setting the effective contact rate (β) to 3.2, the relative increased susceptibility of the more susceptible group (σ) to 10, other famine-related parameters to their null values, and all remaining parameters to their midpoint values with no famine end time, we explore the dynamical effect of certain combinations of famine-related parameters on TB dynamics. For both graphs, curve 1 shows the TB mortality curve with no famine-related changes in parameters. (A) A three-fold increase in the background mortality (δμ = 3) rate leads to a decrease in the number of TB mortalities since death due to non-TB causes depletes those at-risk for TB death (curve 2). A three-fold decrease in immunity conferred by latency (δζ = 0.3) results in more TB mortalities since more individuals become infected (curve 3). However, a three-fold increase in the background mortality rate in combination with a three-fold decrease in immunity conferred by latency results in a minimal change to the TB mortality curve (curve 4). (B) A 25% increase in the probability of fast-progression (δp = 1.25) leads to an increase in the model-predicted number of TB mortalities during the first few years of the epidemic (curve 2). However, somewhat paradoxically, higher TB death rates do not necessarily lead to increased TB mortality at population-level. This is due to the fact that with lower TB death rates individuals with TB are infectious for more time and thus are able to infect more individuals, ultimately leading to a greater number of TB deaths in the population. With a two-fold increase in the TB death rate (δ(μTB) = 2), we see fewer TB mortalities (curve 3). However, a two-fold increase in the TB death rate in combination with a 25% increase in the probability of fast progression results in a minimal change to the TB mortality curve (curve 4).

