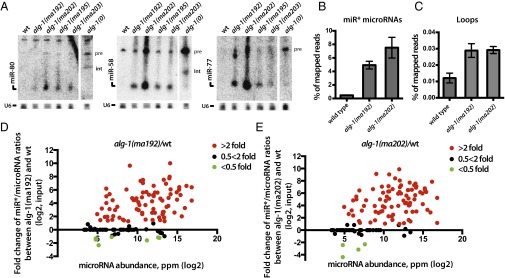
Fig. 2.

alg-1(anti) mutants show an accumulation of miR* strands in total RNA. (A) Northern blot analysis of total RNA extracted from wild-type and alg-1 mutants using probes against miR* strands (pre, precursor microRNA; int, intermediate species of microRNA processing presumably containing the passenger strand and the loop). (B and C) Deep-sequencing analysis of small RNA populations from wild-type, alg-1(ma192) and alg-1(ma202) mutant animals shows an increase in miR* populations (B) and loop accumulation (C) in the alg-1 mutants compared with wild-type. (D and E) Scatterplots showing fold-change in individual miR*/miR ratios between alg-1(anti) and wild-type total RNA. Increased miR*/miR ratio is seen in alg-1(ma192) (D) and alg-1(ma202) (E) mutants and is independent of microRNA abundance (ppm). Red dots represent microRNAs with an increased miR*/miR ratio in the alg-1 mutant over wild-type of at least twofold; green dots represent miRNAs with a decreased miR*/miR ratio in the alg-1 mutant compared with wild-type of at least twofold. Black dots represent no change in miR*/miR ratio in the alg-1 mutants compared with wild-type.
