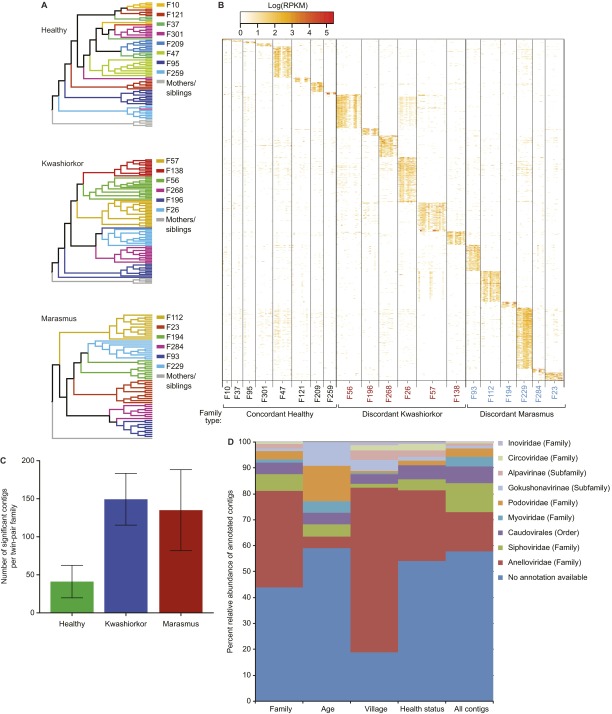
Fig. S6.
Contigs that discriminate different human families. (A) UPGMA clustering (Hellinger distance metric) shows a significant grouping of twin pair viromes. Clustering is more robust in families containing twin pairs discordant for kwashiorkor or marasmus compared with those containing concordant healthy pairs. (B) Contigs as signatures of twin pairs. The Random Forests classifier was used to identify contigs that are significantly associated with a given human family (without considering mothers or older siblings). After 100 independent runs, the accuracy of classification of a given VLP sample to the corresponding human family was 91.2%. The most significant variables (contigs) were selected, and a heat map of their normalized abundances per fecal VLP sample was generated. Columns represent individual samples sorted by family. Tick marks divide samples from each cotwin in a pair; for each twin, columns are sorted by chronological age. Each row represents significantly discriminatory contigs. Family IDs are colored according to health status: red, family with a twin pair discordant for kwashiorkor; blue, family with a twin pair discordant for marasmus; black, family with a concordant healthy pair. (C) Number of family discriminatory contigs as a function of twin health status. Discriminatory contigs are those selected using thresholds described in SI Methods and Fig. S7. These contigs are shown in the heat map in B. Note that a significantly greater number of contigs discriminate families containing SAM discordant twin pairs compared with families with concordant healthy twin pairs (P = 0.02; Kruskal–Wallis test). (D) Distribution of taxonomic annotations for discriminatory contigs. Relative abundance of viral contigs with taxonomic annotations and relative abundances of ≥1% in fecal VLP DNA viromes are shown. The right column (“all contigs”) indicates the distribution of annotations of contigs in the full dataset. Other columns represent the distribution of annotated contigs in the different discriminatory models. The distribution of annotations in these models is significantly different from the full dataset (P = 0.0208; two-way ANOVA), indicating that discriminatory contigs are not a random subset of the complete dataset.

