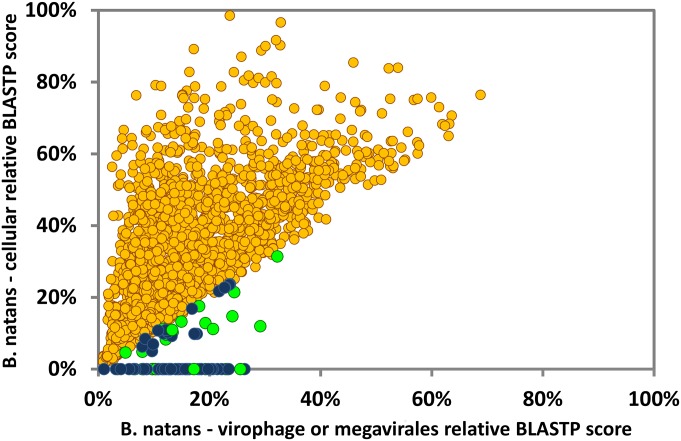
Fig. 1.
Similarity plot of B. natans proteins against virophage/NCLDV and cellular best hits. Circles represent relative BLASTP scores of B. natans proteins aligned against their best cellular hits in the NR database (y axis) and their best viral hits among NCLDVs or virophages. When no cellular hit was recorded whereas a viral hit was obtained, the cellular score was set to zero. BLAST scores were normalized by dividing them by the score of the alignment of the query sequence against itself. Circles are colored according to the origin of the best overall scoring hit (yellow, cellular organisms; blue, virophages; green, NCLDVs).

