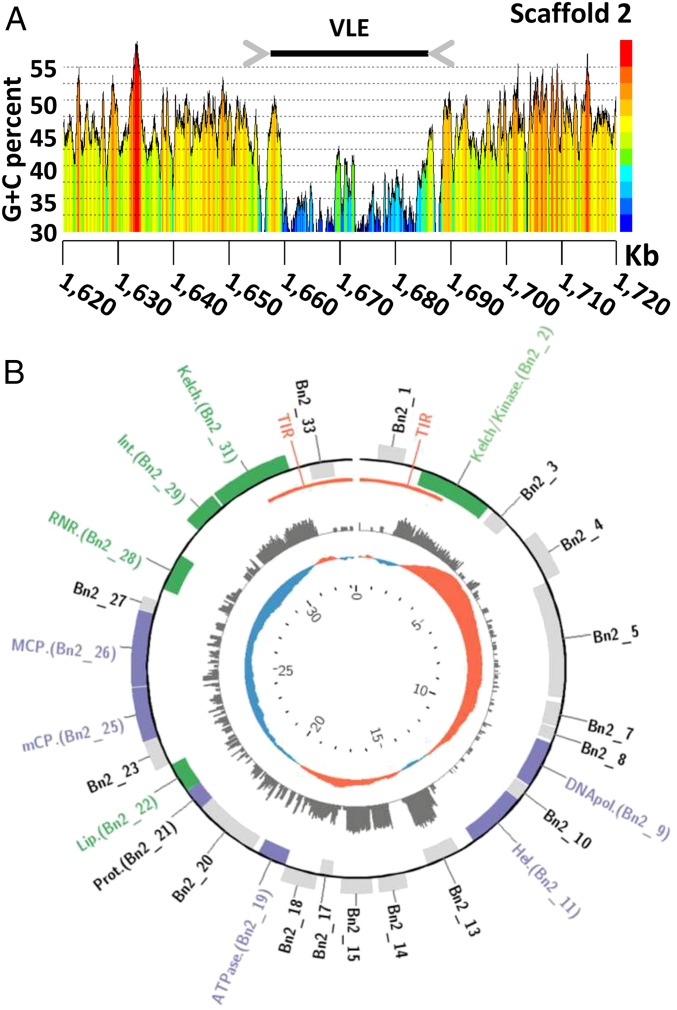
Fig. 2.
Schematic representation of the largest virophage-like element of B. natans. (A) G+C content curve in the region of the virophage-like element on scaffold 2. (B) Gene map of the linear virophage-like element. Genes displayed on the outer and inner rims of the outermost track are coded on the direct (Watson) and reverse (Crick) strand, respectively. Purple and green genes correspond to core virophage genes and genes with annotated functions, respectively. The middle track indicates the number of RNA-seq reads mapped to the regions (logarithmic scale). The inner track represents the G+C skew, with positive values in red and negative values in blue. The genome coordinates (in kb) are indicated in the innermost track of the map.

