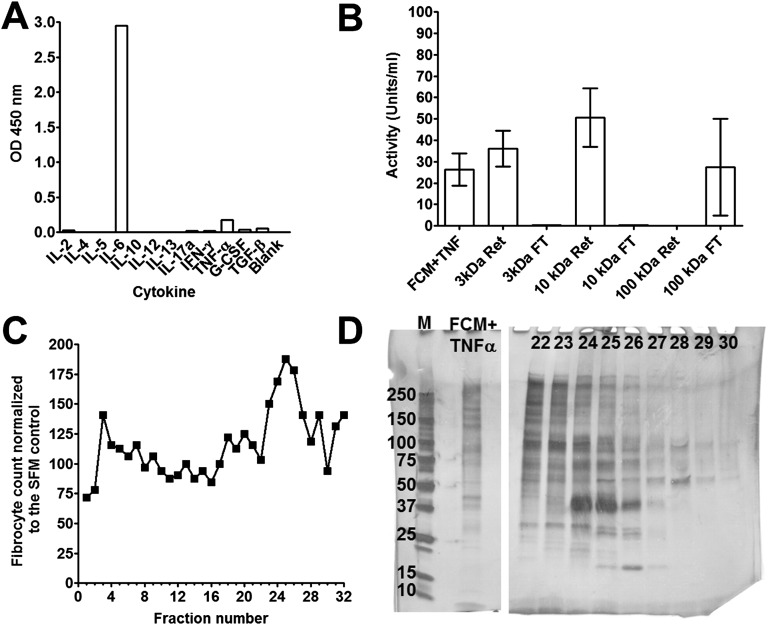
Fig. S1.
Fractionation of FCM+TNF-α and identification of lumican. (A) FCM+TNF-α was collected and analyzed for cytokines. (B) FCM+TNF-α was fractionated by centrifugation using 100-, 10-, and 3-kDa cutoff filters. PBMC were cultured for 5 d in the presence or absence of FCM+TNF-α, retentate (Ret), or flow through (FT). After 5 d, the number of fibrocytes was counted. Values are mean ± SEM, n = 3. (C) Fractions (10% v:v) from an ion exchange column were incubated with PBMC for 5 d, and fibrocytes were counted. (D) The size-fractionated FCM+TNFα loaded onto, and fractions from, the ion exchange chromatography were analyzed by PAGE on a 10% reducing gel. M is molecular mass markers with masses in kDa indicated at left. Numbers indicate fractions from C. The cell counts and gel are representative of three independent experiments.

