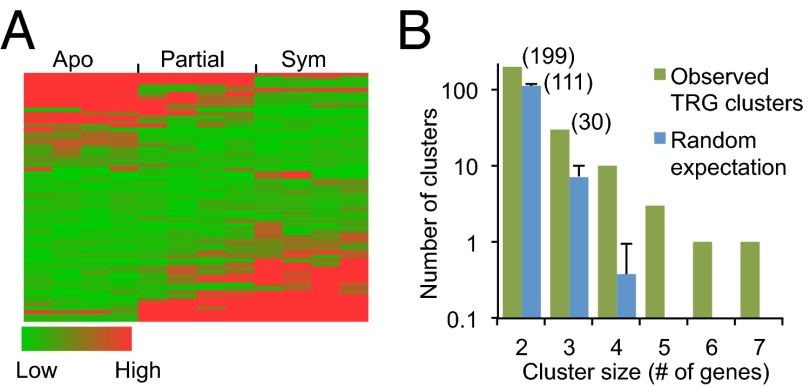
Fig. 3.
Differential expression and nonrandom chromosomal clustering of taxonomically restricted genes (TRGs) in Aiptasia. (A) Heat map of FPKM expression values (SI Appendix, SI Materials and Methods) for 63 putative TRGs with expression-level changes of ≥eightfold (up or down) between partially (Partial) or fully (Sym) infected anemones and anemones without dinoflagellates (Apo). (B) To evaluate genomic clustering, the observed numbers of clusters of two or more putative TRGs without intervening genes were compared with the expectations based on a random distribution of such genes in the genome (SI Appendix, SI Materials and Methods). Error bars indicate SDs; numbers in parentheses indicate the actual numbers of clusters of those sizes.

