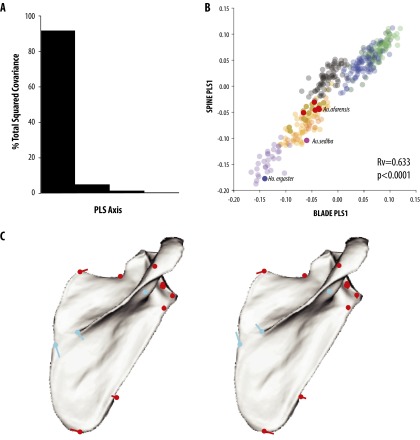
Fig. S2.
Partial least squares (PLS) results. (A) Distribution of covariation between blade and spine shows that the majority of shape variation is associated with the first axis. (B) Plot of PLS1 axes for blade and spine variation shows a highly significant association of shape variation covariation (Rv = 0.633, P < 0.0001). (C) Associated PLS shape vector direction and magnitudes for positive (+0.10) and negative (−0.15) shown on the mean configuration (red, blade landmarks; blue, spine landmarks).

