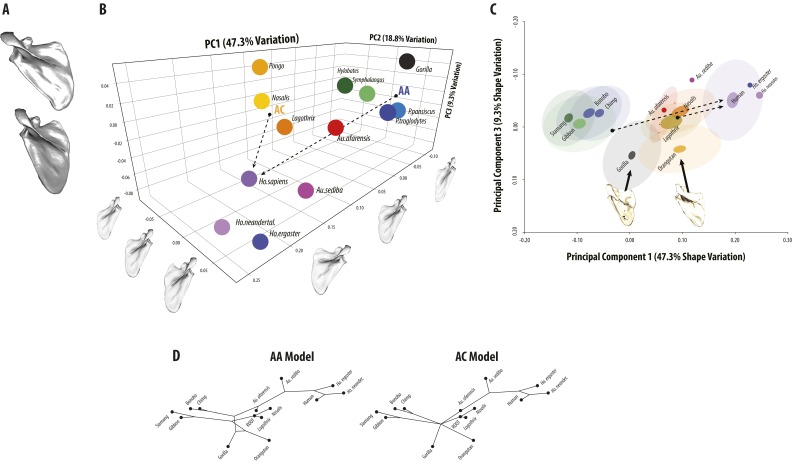
Fig. S3.
Extended PCA results. (A) Visualization of PC3 shape changes from positive (Top) to negative (Bottom). Gorilla and Pongo differ from all other taxa in having moderately wider scapula beyond those identified in PC1. (B) Three-dimensional scatterplot of PC1, PC2, and PC3. Dashed lines show approximate direct evolutionary vectors connecting hypothesized ancestral and descendant species for the AA and AC models. (C) Two-dimensional scatterplot of PC1 vs. PC3 with examples of Gorilla and Pongo shown. (D) Reconstructed phylogenetic trees from the PC1 and PC3 morphospace from Fig. 2. Note that the PC3 axis is reversed in A and B relative to the trees shown in C and D.

