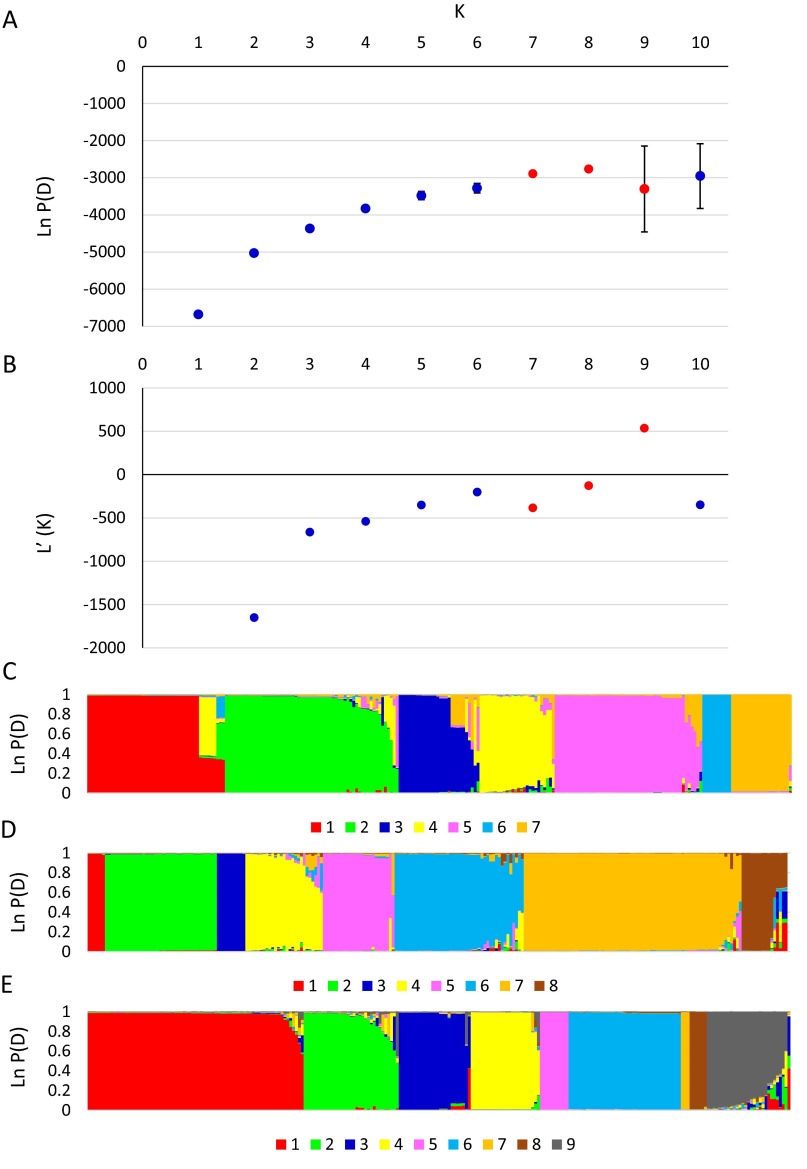
Fig. S2.
Estimate of the ancestral population number (K) for E. tenella produced using STRUCTURE. (A) Plot of the mean log likelihood of the data [Ln P(D)] and associated SDs. Data points colored red were selected for further population structure illustration in C–E. (B) Plot of the mean difference between successive likelihood values of K [L′(K)]. (C–E) Population structure calculated using ancestral population sizes (K) of 7 (C), 8 (D), and 9 (E).

